Stefano Costa

There's more than potsherds out here

Faccio l’archeologo e vivo a Genova

Categoria: Digital Humanities

  • La peste a Marzano negli anni 1656-1657

    La peste a Marzano negli anni 1656-1657

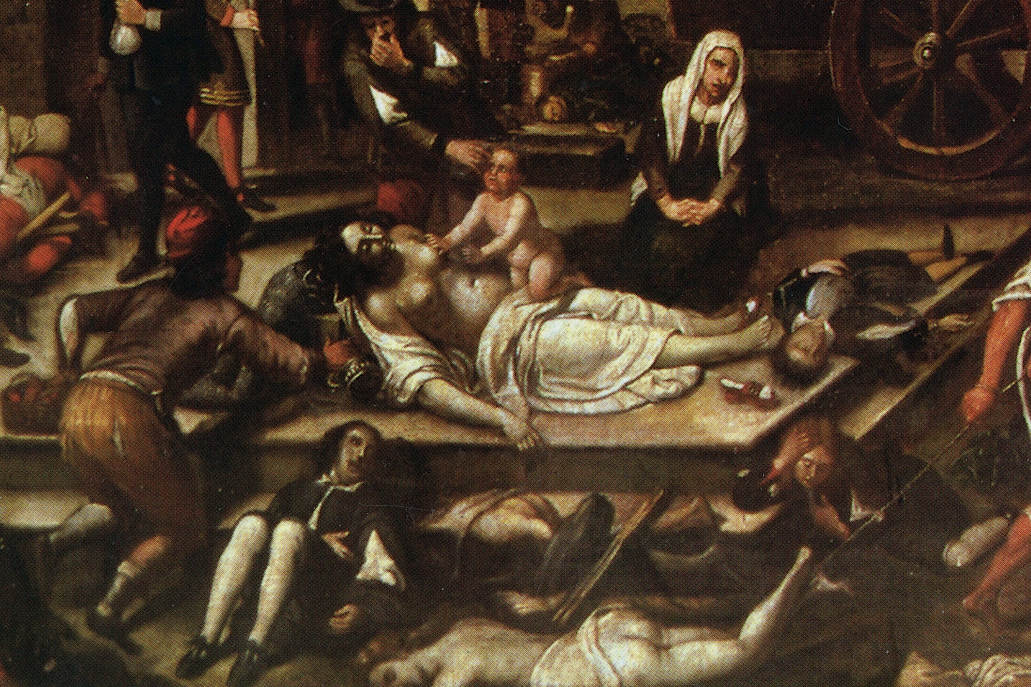
    Quasi tutti ricordano la peste che fa da sfondo ai Promessi Sposi di Alessandro Manzoni. L’epidemia colpì Milano nel 1630 ma risparmiò Genova e la Liguria. Nel 1656 però un’altra ondata di peste bubbonica arriva qui. Colpisce duramente gli abitanti di grandi città come Roma, Napoli e Genova. Non rimangono immuni nemmeno i centri abitati più piccoli come Torriglia e soprattutto, per questa terza pillola storica, anche a Marzano arriva la peste.

    Proprio come avviene oggi con l’epidemia Covid, vengono prese misure drastiche. Marzano è tra le “ville” sospese dalle quali è vietato spostarsi, insieme a Tercesi e Olcesi, perché è un luogo di contagio. Un lockdown in piena regola.

    I controlli sono effettuati da guardie armate delle milizie, che per ogni villa sono sotto un caporale. Niente moduli di autocertificazione, ma proprio come oggi le forze dell’ordine sono impegnate per un rigido controllo degli spostamenti. Conosciamo almeno un caso di violazione del divieto nel mese di ottobre 1656, quando Geronimo e Antonio Costa di Marzano sono denunciati dal caporale Benedetto Mangini per essersi allontanati più volte dai confini imposti.

    In questi anni gli abitanti di Marzano sono circa un centinaio divisi in 18 famiglie (fuochi). Lo sappiamo dal giuramento prestato il 29 novembre 1654 al principe Gio Andrea Doria, a cui prendono parte tutti i capifamiglia. Non abbiamo idea del numero di vittime dell’epidemia, ma a Genova le stime sono nell’ordine delle decine di migliaia di morti e secondo alcuni cadde il 70% della popolazione. Se andassimo a consultare i registri dei defunti nell’archivio parrocchiale avremmo un’idea più precisa. Certo, in un luogo di poche case come Marzano è più facile mantenere (consciamente o meno) quel distanziamento che aiutava a limitare la diffusione del morbo. Non c’erano strumenti particolari per aumentare i controlli, mentre oggi i droni e le celle telefoniche ci guardano di continuo (a proposito: chi manovra il drone che ogni tanto vola sopra le case?).

    Per contrastare l’epidemia si ricorre ovviamente anche alla fede. La cappella della Panteca, intitolata tra gli altri a San Luigi Gonzaga (e forse anche a San Rocco) sembra proprio un esempio di ex voto collettivo e penso che la sua costruzione risalga a questo periodo. D’altronde, la stessa chiesa di San Bartolomeo a Marzano era stata consacrata pochi anni prima.


    Queste notizie sono tratte dai documenti conservati nell’archivio comunale, grazie al lavoro minuzioso di Mauro Casale pubblicato nei due libri La magnifica comunità di Torriglia e Castrum Turrilie. Quindi mi sono basato in prevalenza sulla lettura di questi volumi. Nel 2017 c’è stata una bella mostra dedicata alla peste di Genova del 1656-1657 al Museo dei Beni Culturali Cappuccini. Il libro recente più completo sull’argomento è quello di Romano Da Calice del 2004, La grande peste : Genova 1656-1657.

  • I visitatori dell’Acquario di Genova, edizione 2015

    I visitatori dell’Acquario di Genova, edizione 2015

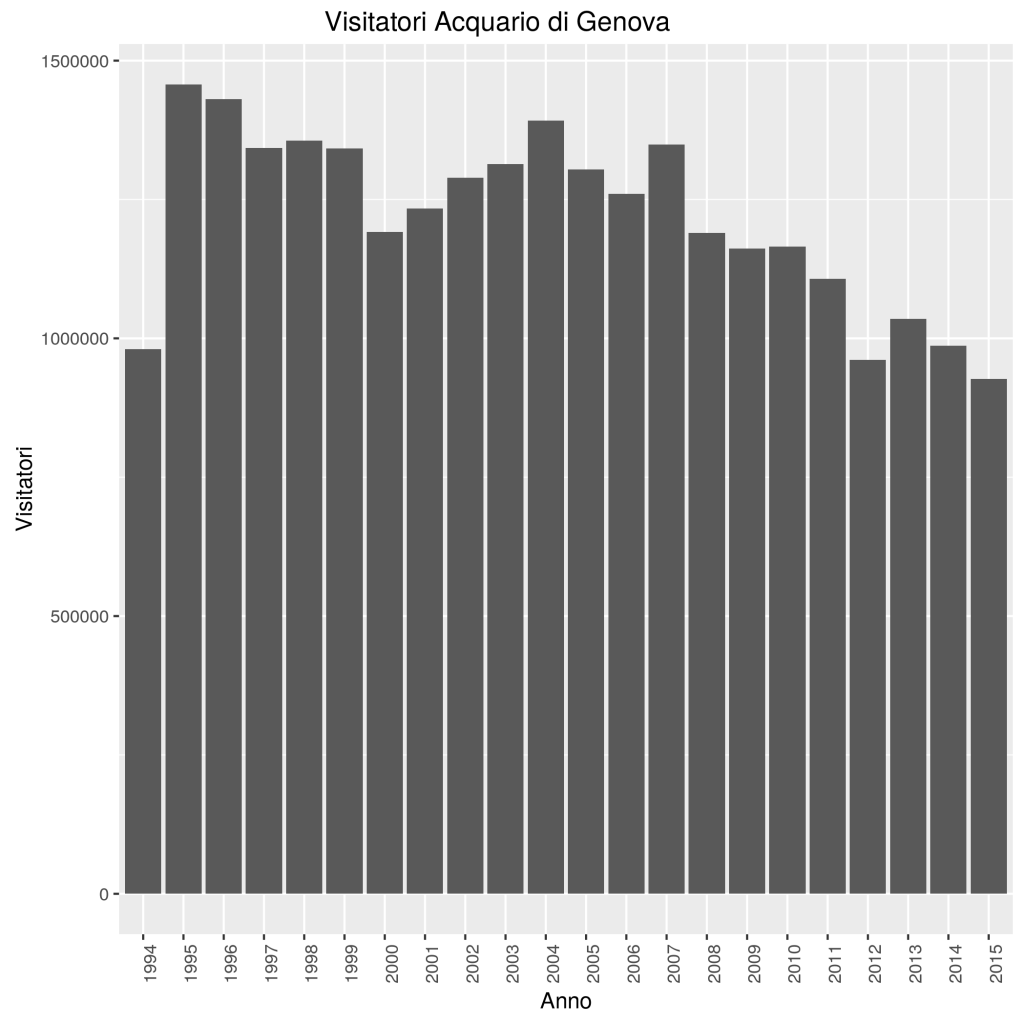
    Lo scorso anno avevamo visto, in una panoramica sui musei di Genova, come l’Acquario, l’attrazione cittadina più conosciuta, più pubblicizzata e più visitata, abbia perso visitatori in modo costante negli ultimi anni, arrivando negli ultimi quattro anni per ben tre volte (2012, 2014, 2015) sotto la soglia psicologica di un milione di visitatori.

    I dati pubblicati di recente nel Cruscotto dell’economia genovese, pur approssimativi, confermano la continua stagnazione: nel 2015 l’Acquario ha totalizzato 927000 presenze, con un calo percentuale del 6.1%. E pensare che lo scorso anno avevo azzardato una previsione ottimistica:

    Sicuramente sarà la struttura che beneficerà maggiormente dell’afflusso di Expo, e i filmati pubblicitari sono già diffusi nelle stazioni ferroviarie e in altri spazi affollati.

    Invece niente, anzi: durante i mesi di Expo i visitatori sono stati costantemente inferiori rispetto ai periodi estivi degli anni precedenti. Ma come è possibile? La risposta è abbastanza elementare: nel 2015 sono calati anche i visitatori dei musei, mentre sono aumentati leggermente gli arrivi turistici. Non è l’acquario e non sono i musei a tenere a galla la giovane vocazione turistica di Genova.

    I numeri crudi sull’affluenza all’Acquario di Genova sono schietti. Tutti i grafici presentati sotto si basano sui dati pubblicati dal Comune di Genova.

    Grafico che mostra i visitatori dell'Acquario di Genova dal 2010 (1166000) al 2015 (927000)
    I visitatori dell’Acquario di Genova dal 2010 al 2015 presentati dal Cruscotto sull’economia genovese

    Se li osserviamo su un arco temporale più ampio di quello presentato nel cruscotto, il calo costante appare ancora più vistoso.


    Grafico con i visitatori dell'Acquario di Genova dal 1994 al 2015, anno per anno
    I visitatori dell’Acquario di Genova dal 1994 al 2015

    Lo scorporo mensile dei dati è ancora più interessante perché consente di esaminare i dati destagionalizzati.

    Graico del trend destagionalizzato del numero di visitatori all'Acquario di Genova
    Trend destagionalizzato del numero di visitatori all’Acquario di Genova

    Pur altalenante, la curva del trend è inequivocabilmente rivolta verso il basso. Non capisco quindi su quali basi Giuseppe Costa possa parlare di

    un periodo decisamente più roseo per l’Acquario con «numeri di molti vicini al periodo pre-crisi».

    (tralasciamo le valutazioni di pura fantasia che compaiono nelle interviste realizzate nella stessa occasione sui “milioni di visitatori” attratti ogni anno a Genova dall’Acquario)

    Peraltro, a gennaio lo stesso Costa aveva ammesso, commentando gli stessi dati, che

    L’anno appena trascorso, che noi calcoliamo dall’1 novembre 2014 al 31 ottobre 2015, è stato il peggiore della storia

    Nel periodo pre-crisi (2008, si suppone), l’Acquario aveva un milione e trecentomila visitatori all’anno, mentre nel 2015 è fermo a 927mila.

    Dato il ritardo con cui vengono pubblicati i dati, non siamo in grado di sapere se la primavera del 2016 sia stata davvero più rosea, e ci piacerebbe poter fare queste valutazioni in tempi più rapidi, perché sono importanti per capire cosa sta succedendo prima che sia già l’anno prossimo. Per esempio, se a metà di Expo avessimo già saputo che l’Acquario non stava riscuotendo particolare successo di pubblico, si sarebbe potuta cambiare strategia di comunicazione. Per ora, ci dobbiamo accontentare dell’ottimismo con con si prevedono un milione e centomila visitatori.

  • The life of Andrew of Crete

    The life of Andrew of Crete

    Andrew of Crete was a (famous) archbishop of Crete during the early 8th century. He is a venerated as a saint by both the Orthodox and the Catholic church, and even today he is particularly appreciated as a hymnographer.

    Andrew was born in Damascus, spent his early years in Jerusalem (and that’s why he’s also known as Andrew of Jerusalem) and he only spent a fraction of his life in Crete, but from his biography we learn that he was particularly active in the “typical” activities of an archbishop, such as building new churches, taking care of the existing ones, etc. Given the scarcity of written sources about Crete in the 8th century, the life of Andrew of Crete is an important historical document for the study of this period. However, it should be noted that no more than half of the text is about the years Andrew served as ἀρχιεπίσκοπος τῆς Κρητῶν φιλοχρίστου νήσου, archbishop of the Christian island of Crete.

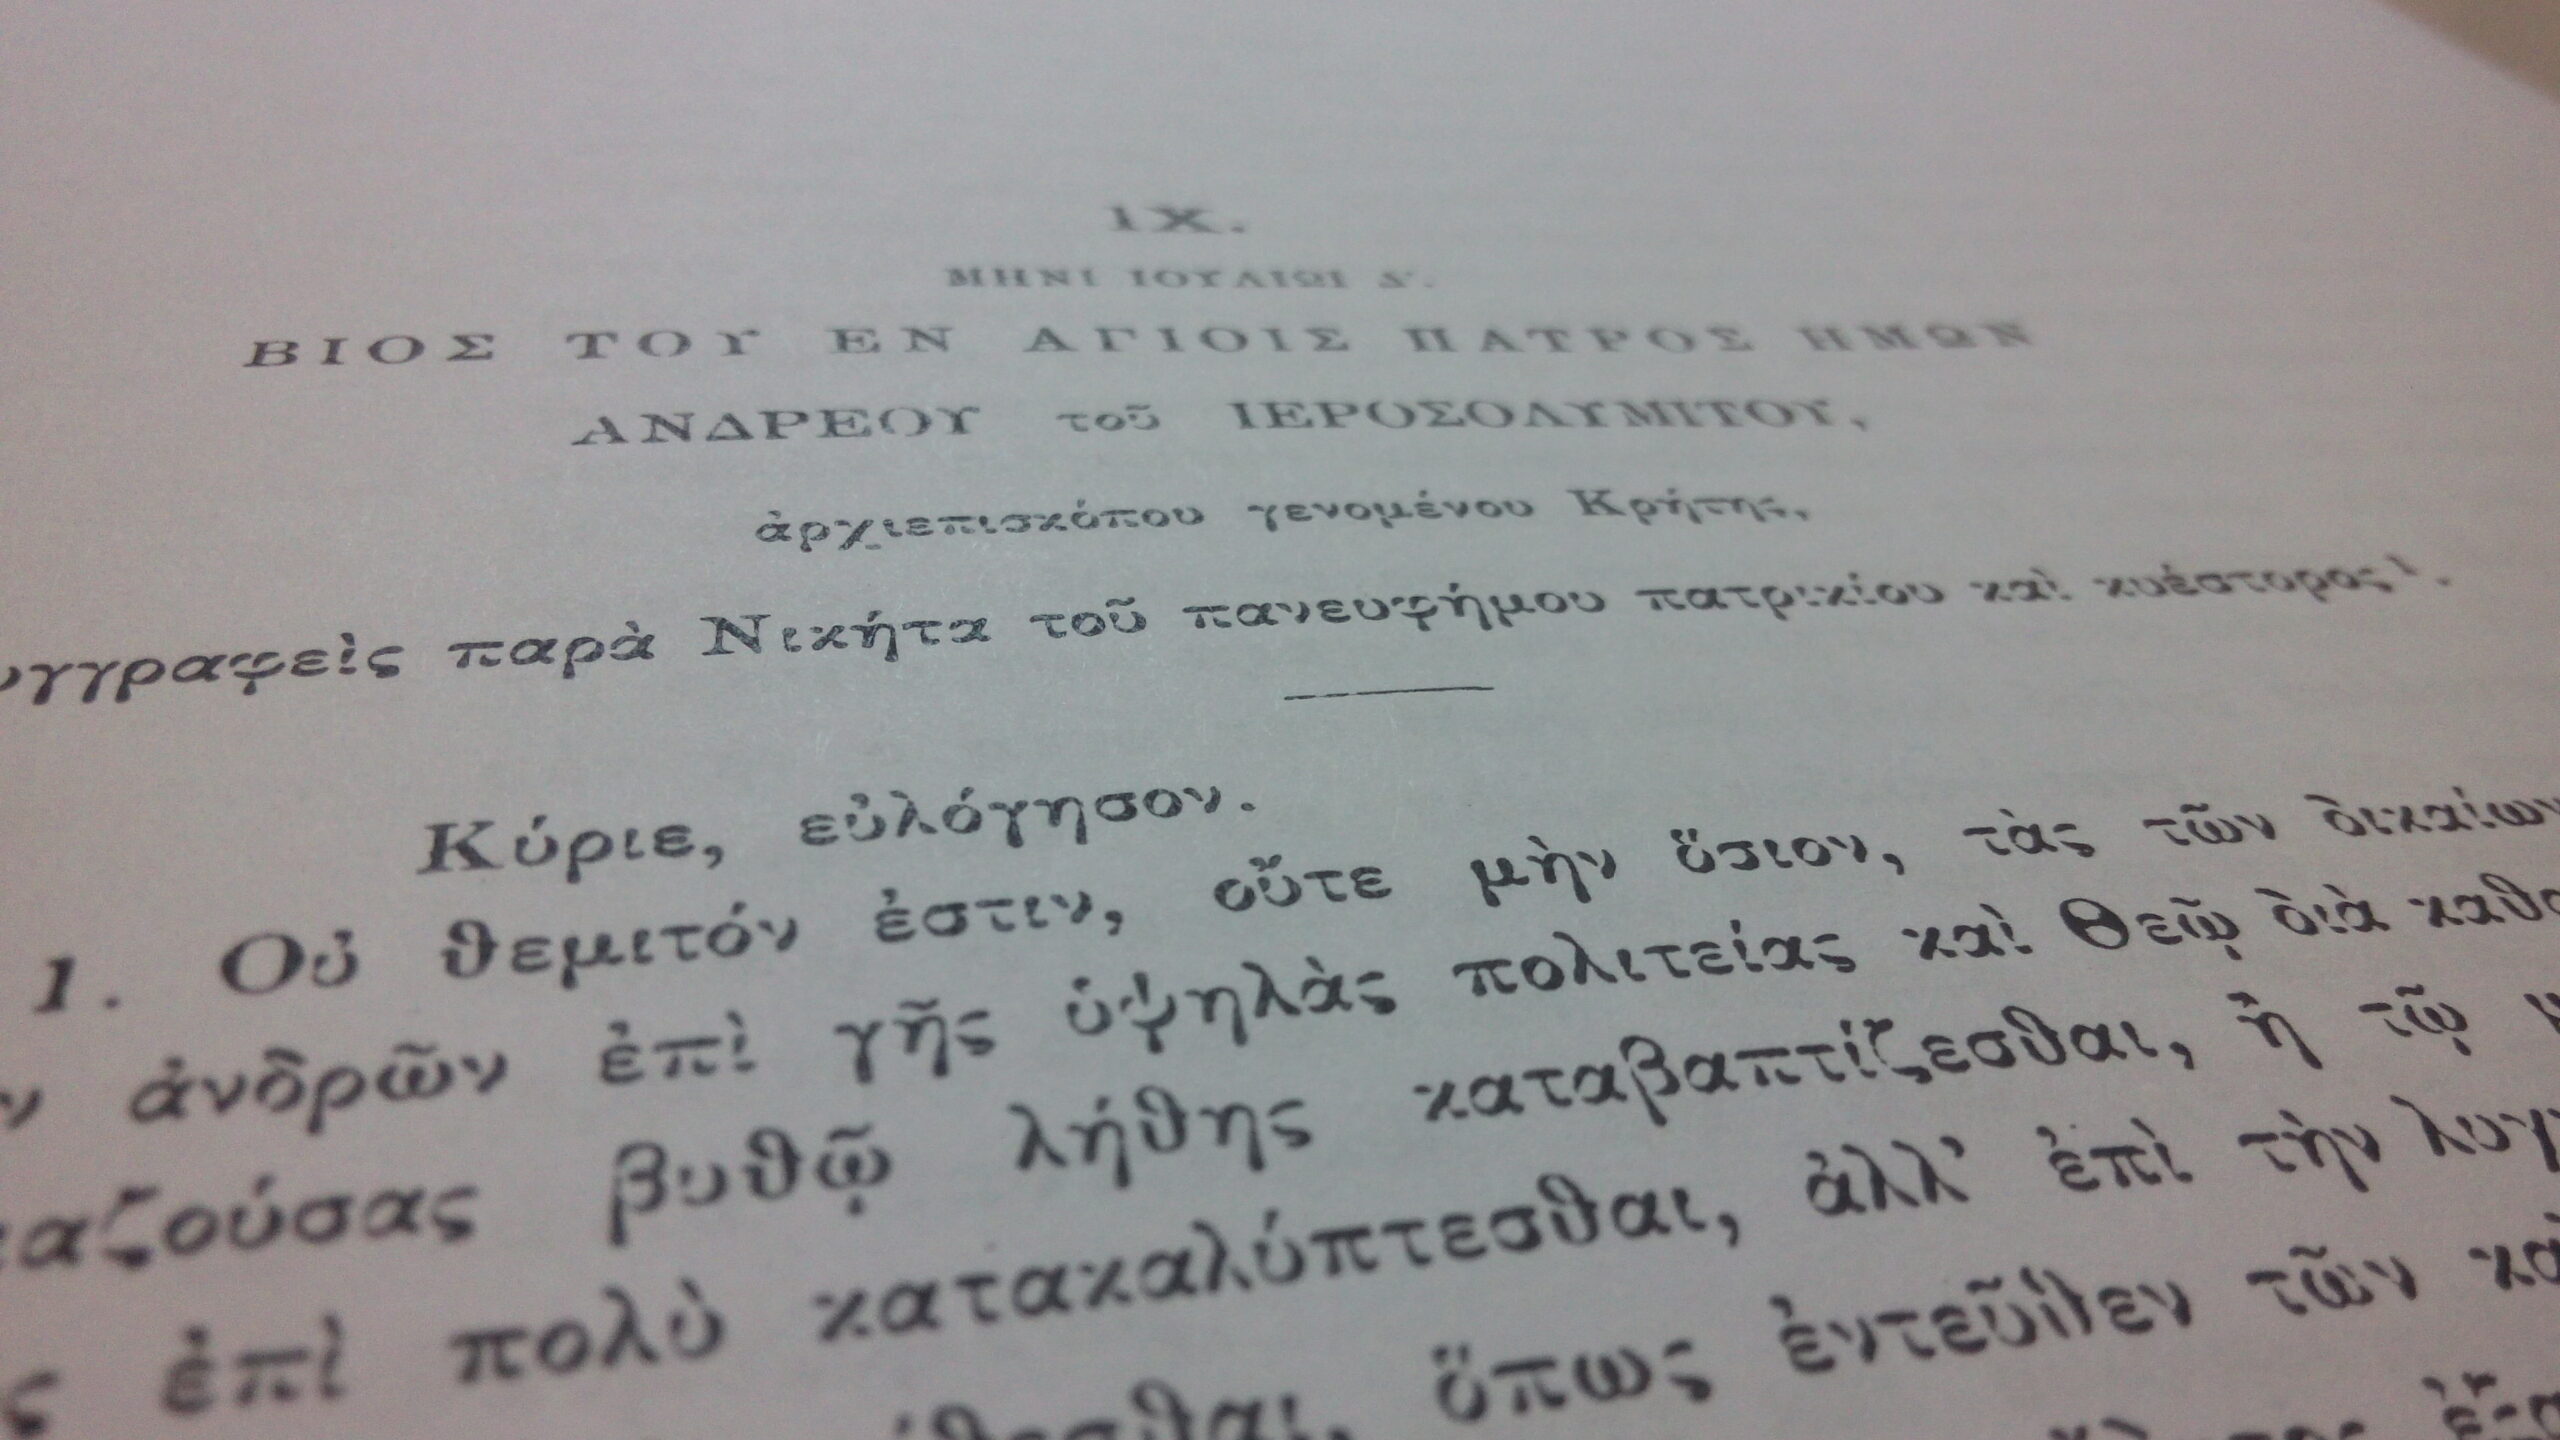
    I heard several mentions of this biography in Rethymno last month so I was rather curious. To my discontent, I could only find the same boilerplate summary of the life everywhere on the many thematic websites dedicated to Christian saints, and even Wikipedia doesn’t stand out as particularly accurate. What is really disappointing is that nowhere was a reference to the actual biography! Still, that was published in Saint Petersburg in 1898, in volume 5 of the Ανάλεκτα Ιεροσολυμιτικής σταχυολογίας, with the descriptive title of Βίος του εν αγίοις πατρὸς ημων Ανδρέου του Ιεροσολυμίτου, ὰρχιεπισκὸπου γενομένου Κρήτης. This reference is found in some scholarly publications, such as G. Kourtzian’s «L’incident de Knossos (fin Septembre/début Octobre 610)», Travaux et mémoires, vol. 17, 2013, p. 182 (even though the reference has the wrong publication year). The links above point to the Internet Archive: the life of Andrew of Crete is actually available on the Web but it is difficult to find. Unfortunately the Google scan on the Internet Archive is missing two pages (170-171).

    There are two manuscripts for the biography of Andrew, one from the monastery of Vatopedi, the other from Agios Dionisios, both on Mount Athos.

    I have started a transcription at Wikisource. I had never typed polytonic Greek before, but it’s very easy to get a decent typing speed on GNU/Linux following the document Writing Greek, Greek Polytonic (Ancient Greek) on Linux by Simos Xenitellis.

  • Being a journal editor is hard

    Being a journal editor is hard

    I’ve been serving as co-editor of the Journal of Open Archaeology Data (JOAD) for more than one year now, when I joined Victoria Yorke-Edwards in the role. It has been my first time in an editorial role for a journal. I am learning a lot, and the first thing I learned is that being a journal editor is hard and takes time, effort, self-esteem. I’ve been thinking about writing down a few thoughts for months now, and today’s post by Melissa Terras about “un-scholarly peer review practices […] and predatory open access publishing mechanisms” was an unavoidable inspiration (go and read her post).

    Some things are peculiar of JOAD, such as the need to ensure data quality at a technical level: often, though, improvements on the technical side will reflect substantially on the general quality of the data paper. Things that may seem easily understood, like using CSV for tabular data instead of PDF, or describing the physical units of each column / variable. Often, archaeology datasets related to PhD research are not forged in highly standardised database systems, so there may be small inconsistencies in how the same record is referenced in various tables. In my experience so far, reviewers will look at data quality even more than at the paper itself, which is a good sign of assessing the “fitness for reuse” of a dataset.

    The data paper: you have to try authoring one before you get a good understanding of how a good data paper is written and structured. Authors seem to prefer terse and minimal descriptions of the methods used to create their dataset, giving many passages for granted. The JOAD data paper template is a good guide to structuring a data paper and to the minimum metadata that is required, but we have seen authors relying almost exclusively on the default sub-headings. I often point reviewers and authors to some published JOAD papers that I find particularly good, but the advice isn’t always heeded. It’s true, the data paper is a rather new and still unstable concept of the digital publishing era: Internet Archaeology has been publishing some beautiful data papers,and I like to think there is mutual inspiration in this regard. Data papers should be a temporary step towards open archaeology data as default, and continuous open peer review as the norm for improving the global quality of our knowledge, wiki-like. However, data papers without open data are pointless: choose a good license for your data and stick with that.

    Peer review is the most crucial and exhausting activity: as editors, we have to give a first evaluation of the paper based on the journal scope and then proceed to find at least two reviewers. This requires having a broad knowledge of ongoing research in archaeology and related disciplines, including very specific sub-fields of study ‒ our list of available reviewers is quite long now but there’s always some unknown territory to explore, for this asking other colleagues for help and suggestions is vital. Still, there is a sense of inadequacy, a variation on the theme of impostor syndrome, when you have a hard time finding a good reviewer, someone who will provide the authors with positive and constructive criticism, becoming truly part of the editorial process. I am sorry for the fact that our current publication system doesn’t allow for the inclusion of both the reviewers’ names and their commentary  ‒ that’s the best way to provide readers with an immediate overview of the potential of what they are about to read, and a very effective rewarding system for reviewers themselves (I keep a list of all peer reviews I’m doing but that doesn’t seem as satisfying). Peer review at JOAD is not double blind, and I think often it would be ineffective and useless to anonymise a dataset and a paper, in a discipline so territorial that everyone knows who is working where. It is incredibly difficult to get reviews in a timely manner, and while some of our reviewers are perfect machines, others keep us (editors and authors) waiting for weeks after the agreed deadline is over. I understand this, of course, being too often on the other side of the fence. I’m always a little hesitant to send e-mail reminders in such cases, partly because I don’t like receiving them, but being an annoyance is kind of necessary in this case. The reviews are generally remarkable in their quality (at least compared to previous editorial experience I had), quite long and honest: if something isn’t quite right, it has to be pointed out very clearly. As an editor, I have to read the paper, look at the dataset, find reviewers, wait for reviews, solicit reviews, read reviews and sometimes have a conversation with reviewers, if something is their comments are clear and their phrasing/language is acceptable (an adversarial, harsh review must never be accepted, even when formally correct). All this is very time consuming, and since the journal (co)editor is an unpaid role at JOAD and other overlay journals at Ubiquity Press (perhaps obvious, perhaps not!) , usually this means procrastinating: summing the impostor syndrome dose from criticising the review provided by a more experienced colleague with the impostor syndrome dose from being always late on editorial deadlines yields frustration. Lots. Of. Frustration. When you see me tweet about a new data paper published at JOAD, it’s not an act of deluded self-promotion, but rather a liberatory moment of achievement. All this may sound naive to experienced practitioners of peer review, especially to those into academic careers. I know, and I still would like to see a more transparent discussion of how peer review should work (not on StackExchange, preferably).

    JOAD is Open Access. It’s the true Open Access, not to differentiate between gold and green (a dead debate, it seems) but between two radically different outputs. JOAD is openly licensed under the Creative Commons Attribution license and we require that all datasets are released under open licenses so readers know that they can download, reuse, incorporate published data in their new research. There is no “freely available only in PDF”, each article is primarily presented as native HTML and can be obtained in other formats (including PDF, EPUB). We could do better, sure ‒ for example, provide the ability to interact directly with the dataset instead of just providing a link to the repository ‒ but I think we will be giving more freedom to authors in the future. Publication costs are covered by Article Processing Charges, 100 £, that will be paid by the authors’ institutions: in case this is not possible, the fee will be waived. Ubiquity Press is involved in some of the most important current Open Access initiatives, such as the Open Library of Humanities and most importantly does a wide range of good things to ensure research integrity from article submission to … many years in the future.

    You may have received an e-mail from me with an invite to contribute to JOAD, either by submitting an article or giving your availability as a reviewer ‒ or you may receive it in the next few weeks. Here, you had a chance to learn what goes on behind the scenes at JOAD.

  • Quanti visitatori nei musei di Genova?

    Quanti visitatori nei musei di Genova?

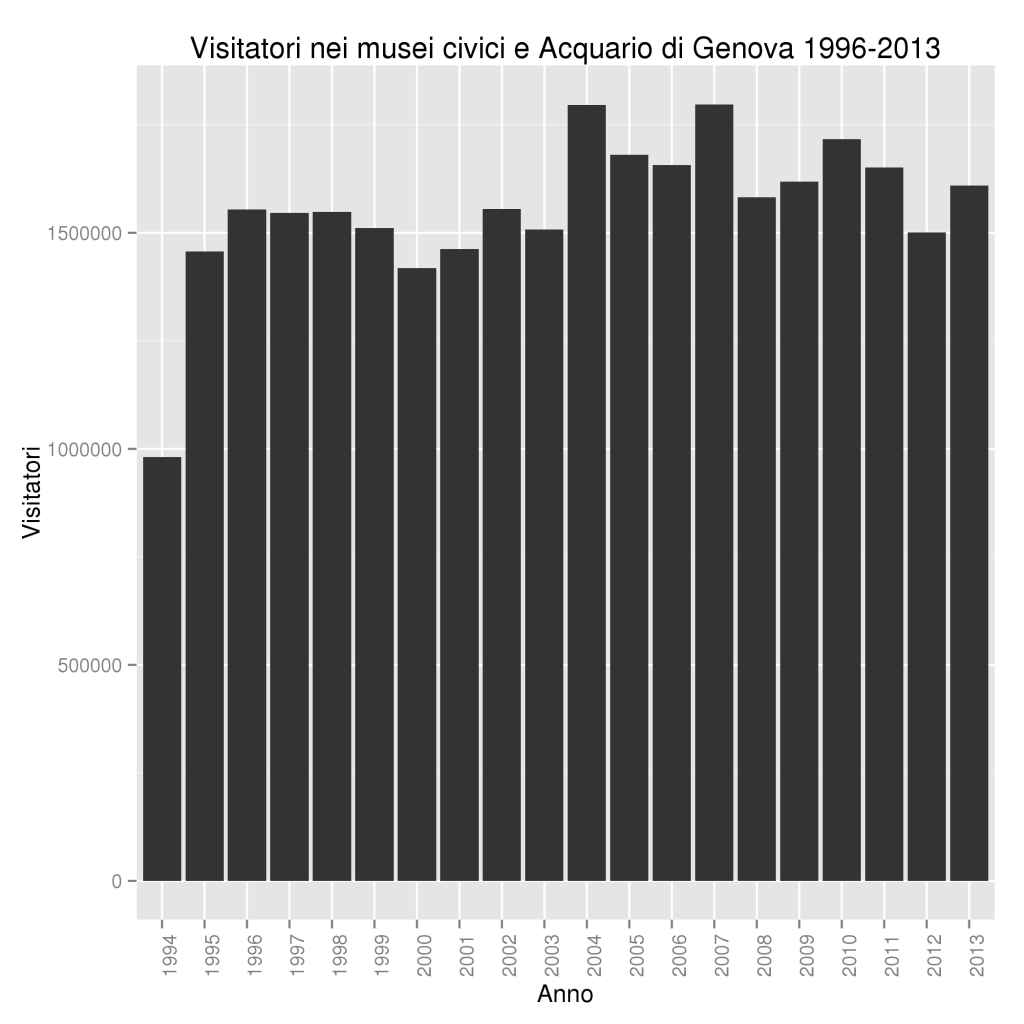
    In attesa che vengano pubblicati i dati aggiornati al 2014, diamo uno sguardo ai dati numerici sui visitatori nei musei civici di Genova negli ultimi anni. La situazione è stabile, ma sembra esserci una stagnazione e l’Acquario non gira. Purtroppo, mancano i dati su Palazzo Ducale.

    Visitatori nei musei civici e Acquario di Genova 1996-2013
    Visitatori nei musei civici e Acquario di Genova 1996-2013

    Nel 2004 Genova è stata Capitale Europea della Cultura. Ce lo ricordiamo bene. I cantieri che sembravano infiniti, le facciate riportate a lustro, le inaugurazioni, le mostre. Qualcosa è rimasto, Genova adesso è una meta turistica, sia per gli italiani sia per gli stranieri. La ricettività inizia a stare al pari con la domanda. Abbiamo un city brand. Ma i musei non sono solo turismo, sono prima di tutto dei cittadini, delle scolaresche che si spostano rumorosamente in autobus, dei gruppi di mezza età, delle famiglie. Quante persone visitano i musei di Genova?

    Dove sono i dati

    Stuzzicato dagli open data rilasciati dalla Fondazione Torino Musei, che peraltro non sono aggiornati da più di un anno, ho cercato quel che c’era in rete sui musei genovesi, quelli civici in particolare (ci sono anche Palazzo Spinola e Palazzo Reale, statali, i cui dati di affluenza sono disponibili). Forse sembrerà ovvio, ma ho trovato davvero poco, veri e propri dati sparsi.

    I dati dal 2004 al 2013 sono compresi nell’Annuario statistico del Comune di Genova (un file XLS dentro uno ZIP). I dati sui musei sono nel file 06 ISTRUZIONE E CULTURA/6.2 Cultura/TAV 07.XLS. Quelli sull’Acquario sono nel file 12 TURISMO/TAV13.XLS.

    Per qualche motivo i dati sui musei dal 1996 al 2008 sono nelle serie storiche (link diretto al file XLS). Le stesse serie storiche abbracciano gli anni dal 1993 al 2008 per l’Acquario (link diretto al file XLS).

    Nel Notiziario statistico n° 3 del 2014 (file PDF) troviamo i dati sul turismo, che includono i visitatori mensili dell’Acquario nel 2013 e fino a settembre 2014, ma non quelli dei musei.

    Il dettaglio maggiore di cui disponiamo è quello mensile per l’Acquario negli ultimi 21 mesi, mentre in tutti gli altri casi siamo fermi al numero totale di visitatori annuali per singolo museo. È difficile fare qualunque valutazione in rapporto agli afflussi turistici, se non a livello molto generale, quindi in questa puntata non ne parlerò proprio.

    I dati sparsi vanno ripuliti e ricomposti per essere elaborati. È un lavoro lento e noioso, in cui sicuramente si possono fare errori. Quello che ho ripulito per ora è in questo repository su GitHub, ovviamente in formato CSV.

    Cosa dicono i dati

    Una premessa doverosa: i numeri sono, per l’appunto, numeri. Un museo poco visitato non è più brutto degli altri, né gestito da persone meno competenti, impegnate, capaci.

    I musei di Genova ospitano collezioni uniche, e soprattutto organizzano una quantità incredibile di eventi ‒ ogni settimana sono decine e spaziano da incontri serali a visite guidate, presentazioni, concerti, laboratori per grandi e piccoli. Nell’ultima newsletter che ho ricevuto posso contare 16 mostre in corso.

    Ricordatevene leggendo il seguito.

    I musei

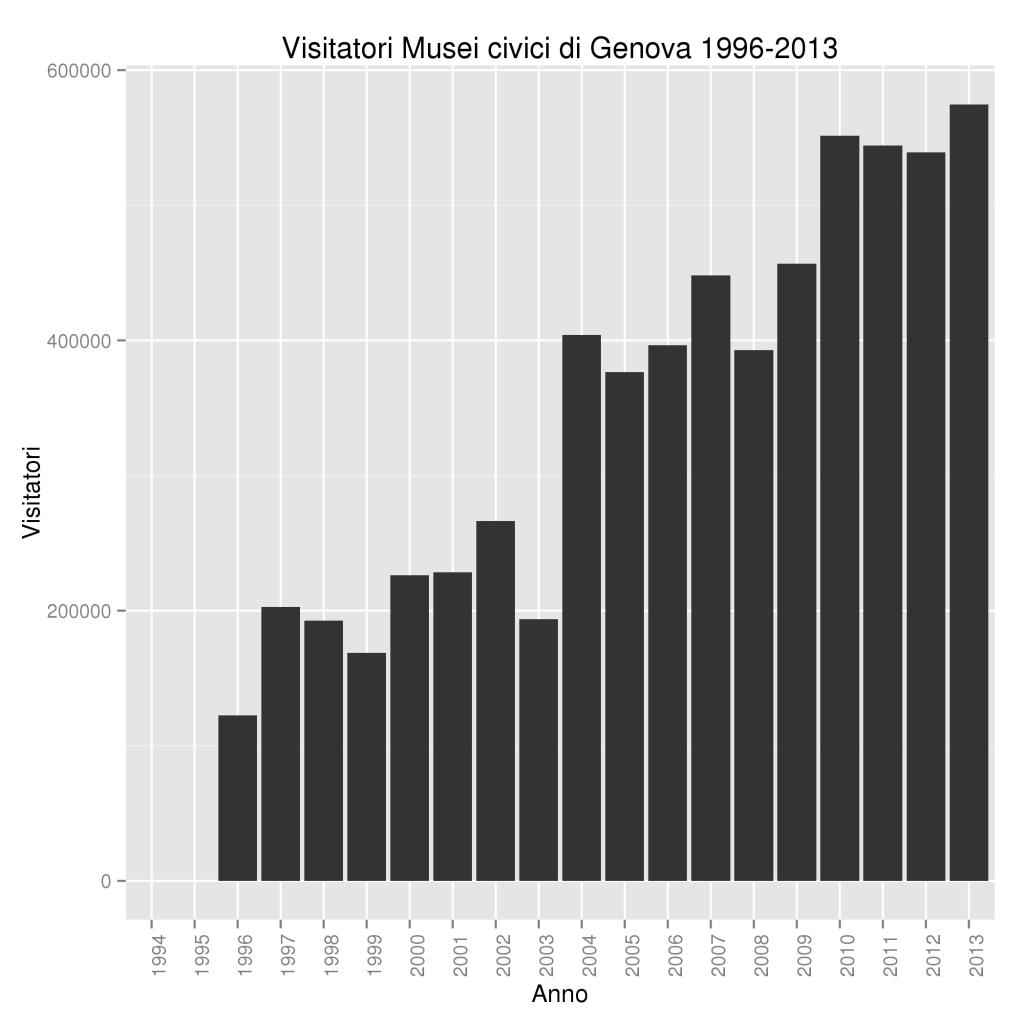
    Il 2004 ha segnato in positivo un punto di non ritorno per la maggior parte dei musei civici genovesi. Il balzo è evidente dal grafico.

    Visitatori nei Musei civici di Genova 1996-2013
    Visitatori nei Musei civici di Genova 1996-2013

    Il dettaglio dei singoli musei è un po’ meno brillante, perché si vedono tramontare realtà come il Museo di di storia e cultura contadina e il Museo di arte contemporanea. Il Galata Museo del mare è in affanno (non sorprendente considerati i numeri dell’Acquario?), anche se rimane il museo più visitato.

    Molti musei hanno andamenti altalenanti, magari legati a mostre (↑) o chiusure (↓) temporanee, su cui naturalmente sarebbe importante avere dati.

    Visitatori nei musei di Genova: il dettaglio dei singoli musei (1996-2013)
    Visitatori nei musei di Genova: il dettaglio dei singoli musei (1996-2013)

    I Numeri solidi

    I numeri più solidi a mio parere sono quelli dei musei di Storia naturale e di Sant’Agostino, gli unici ad avere una quantità considerevole di visitatori associata ad una crescita costante negli ultimi anni. Anche il Museo di Arte Orientale ha avuto un buon andamento nell’ultimo periodo. Sono queste le realtà che meriterebbero di essere analizzate più in dettaglio per individuare fattori positivi su cui costruire, volendo, una strategia più ampia.

    L’Acquario

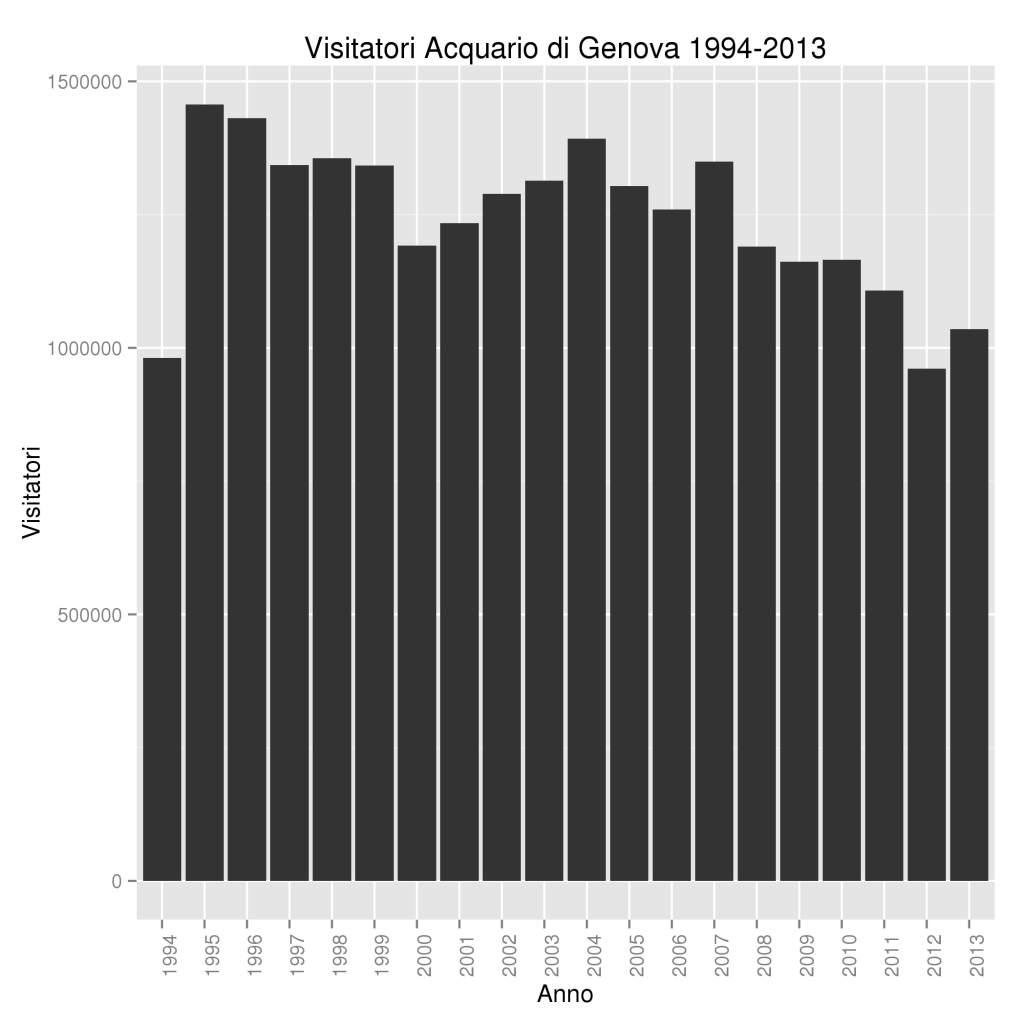
    L’Acquario di Genova non è un museo, almeno non nella tradizionale accezione italiana. Il numero di visitatori dell’Acquario è in calo costante. Dopo il 2004 solo nel 2007 e nel 2013 si è registrato un lieve aumento, ma non ci sono segnali di inversione della tendenza ‒ alla stagnazione più che al ribasso, perché comunque si tratta di una realtà molto forte che non può scomparire da un momento all’altro. Rimane il dubbio sulla sostenibilità di questa impresa, che ha costi altissimi per i visitatori  (24 €) ed evidentemente non riesce a trainare da sola il resto della città, pur rimanendo di gran lunga la struttura più visitata con circa un milione di visitatori ogni anno. Sicuramente sarà la struttura che beneficerà maggiormente dell’afflusso di Expo, e i filmati pubblicitari sono già diffusi nelle stazioni ferroviarie e in altri spazi affollati. Come la Capitale Europea della Cultura, anche Expo può dare uno slancio di medio periodo, ma solo se si saprà lavorare con le lenti multifocali.

    Visitatori Acquario di Genova 1994-2013
    Visitatori Acquario di Genova 1994-2013

    Cosa manca

    I grandi assenti di questa panoramica sono naturalmente i dati su Palazzo Ducale, che non è un museo vero e proprio ma è il principale spazio culturale pubblico della città. Dobbiamo accontentarci di notizie (500mila visitatori nel 2012, chiusura record con 125mila visitatori per Frida Kahlo) ma da una fondazione pubblica sinceramente vogliamo molto di più. Ci vogliono gli open data.

    ~

    Questo post è il primo con l’hashtag #d969humanities. Stay tuned.

    La foto di copertina è “Genova, more than this?”. L’ho scattata io qualche mese fa.

  • Postcards from 1910

    Postcards from 1910

    Digital humanities start at home. I present a small collection of postcards dating from 1908 to 1913, that I scanned yesterday as part of a larger collection of 50 letter envelopes (and few actual letters) that ‒ I think ‒ were sent or brought back to Italy when a relative of ours, Enrichetta Costa, passed away in the U.S. in 1923.

    These postcards are mostly conveying short messages, greetings, recounts of happy moments, and they often mention being in good health. Some of them are written in English, some in Italian, showing both a desire to become one with American culture and the need to stay in contact with families at home. These postcards are glimpses in the life of young women in their 20s, who had recently moved overseas. Looking at post office stamps, one gets the idea of such postcards as “short messages” that were sent from a nearby town, or from another neighbourhood of N.Y, and apparently could take as little as 12 hours to get to their destination.

    The 1913 postcard is actually Italian and was sent from Torriglia to Genoa, where Enrichetta was staying. One has to think she brought the postcard back to the U.S. upon leaving Italy one more time.

    It’s tempting to try building social networks from these letters and postcards, and I already started playing with TimeMapper to follow her across the years, even though the bulk of material (that is, the envelopes… but see how I already detached from the emotional value of the object?) is from 1910. Between March and April 1910 she moved from Baxter Street in New York City to the borough of Woodhaven, but only a few months before she was still in Kingston, N.Y.

    I’m sure there is abundant literature on the subject of life of immigrants in the U.S. West Coast, but the afternoon I spent with my old Epson scanner gave me a lot of time to think about the social struggles of the time ‒ after all she was coming from a family of peasants and had moved overseas at 16 years ‒ and how her personal history became increasingly detached from that of her family of origin, at the same time having strong ties to the immigrant community from Torriglia that had formed around N.Y., until the final letter confirming her death, signed by her friend Cornelia Sciutto (a surname that is highly characteristic of a village nearby Torriglia), otherwise unknown.

    I also came across more mundane problems like what is the best way to present digitally these envelopes. I think we should try using animated GIFs like this one. The original images of the front and back side can be easily retrieved with any image editing software (GIMP in my case) but it’s easier to keep the two sides together, without resorting to ugly non-image formats like PDF. A delay of 3 seconds should work fine for most cases, but it can be adjusted accordingly. It would be rather pointless, but fascinating, to go further and create 3D scans of the envelopes ‒ an unwieldy task for something that is normally flat, on a flat surface, with no tangible “volume”.

    There are other issues with publishing these scans, namely exposing the intimate life of people who have been dead for less than 100 years. Surely no one on Facebook cares that their great-grandchildren will be able to sift through their silly day to day chat messages, but today’s assumptions are not good for last year, let alone last century. I’m relieved by the fact that I have almost only addresses, and names, and post stamp dates ‒ and part of me wants someone in Kingston, N.Y. or Woodhaven to recognise one of those names as a distant relative, a long-forgotten ancestor who was friends with Henrietta Costa. If you’re that someone, it would be nice to get in touch, and the sunny Sunday afternoon I spent scanning was not entirely lost.

    In any case, enjoy the postcards!

  • Civitates in annalibus regni Francorum

    Civitates in annalibus regni Francorum

    The Annales Regni Francorum are a (rather boring) official chronicle of the early Carolingians, covering the years from 741 to 829. I remember studying the historiography of this period in the two classes of Medieval Latin Literature I’ve been following in my college years. What I could not remember, however, is that the Annales cite Populonium, supposedly a settlement not far to Vignale, also known from the Late Antique Tabula Peutingeriana.

    The passage is the following:

    In Tuscia Populonium civitas maritima a Grecis, qui Orobiotae vocantur, depraedata est. Mauri quoque de Hispania Corsicam ingressi in ipso sancto paschali sabbato civitatem quandam diripuerunt et praeter episcopum ac paucos senes atque infirmos nihil in ea reliquerunt.

    Annales Regni Francorum, an excerpt from the 1561 edition. Note the misspelling of magna for maritima, and the fine Greek typing of Οροβιῶται.

    It seems that Populonium was not a humble village, nor a dead city, but a civitas maritima. This small piece of history couples nicely with two documents from the year 770 that were written at the ecclesia S(an)c(t)i Uiti in Cornina, again not far from Vignale. There was a vibrant life, focused around possibly small centres, that were nevertheless part of a very large network, mostly ecclesiastical.

    However, words alone do not tell a story. What was a civitas at the time of Charlemagne? Consistency isn’t perhaps the best quality of a text that could have been composed by ‘cut and paste’ during the late 9th century. On the map below are all the civitates mentioned as such in the Annales.

    There are 40 civitates mentioned in the Annales. Most of them are in Italy and France, the heart of the Kingdom of the Franks, with some also in Germany, Croatia and Spain. Constantinople is a striking presence in this list, being the largest city in the world at that time (possibly together with Harun al-Rashid’s Baghdad). Therefore, it looks like size was not one of the qualifying criteria for defining a civitas. In fact, it becomes clear that they are more of a political body when we find peoples associated with a civitas, as for example the Autosiodorum civitatem where Charlemagne spent some time in the year 778 (if I am not mistaken).

    So maybe it’s the episcopus who grants the title of civitas to Populonium. After all, the notion of civitas in Roman Latin is opposed to other terms defining the physical settlement such as urbs or oppidum, as in this excerpt from Rutilius Namatianus:

    Agnosci nequeunt aevi monumenta prioris:
    Grandia consumpsit moenia tempus edax.
    Sola manent interceptis vestigia muris,
    ruderibus latis tecta sepulta iacent.
    Non indignemur mortalia corpora solvi:
    Cernimus exemplis oppida posse mori.

    ‒ Rutilius Namatianus, De reditu suo, I, 409-414

    ‒ Rutilius Namatianus, De reditu suo, I, 409-414

    I like to cite this passage because it refers to Populonia, the Etruscan and Roman city that ruled the same territory I am discussing. Rutilius wrote his poem in the years 415 or 417, almost four centuries earlier than the texts presented above, so no direct links are (chrono)logically allowed. Whatever happened during those four centuries is a matter for archaeological research.

    The problem with archaeology is that we can assess the rough date when a villa or village were abandoned or founded, but it is more difficult to follow people when they moved, especially if the move is from larger to smaller.

    Making the map

    In the second part of this post I will describe how the above map was made, starting from the historical source.

    Ingredients:

    Tools:

    It should be clear that in the recipe there is a lot of hand-made work.

    First I converted the HTML to plain text with html2text. The resulting file, that I called annales.txt for convenience, was then parsed with grep to identify all the occurrences of the term civitas. The command is:

    $ grep -C 1 annales.txt "civita"

    and allows to match all possible variants of the word, depending on the syntactical context. From the output of grep, I compiled by hand a list of the 40 places shown in the map. With 400, it would have been better to devise a semi-automated procedure, but in this case I preferred to concentrate on the results. A list of place-names is perfect for geocoding, except that there is no geocoding service for the 9th century! My list became a table (in a CSV file), and in a second column I added the modern name of the place, together with the country and the ZIP code to make geocoding more reliable.

    Enter geopy, a Python library for geocoding, that supports several backend services, including GeoNames. A short script, and we have a set of coordinates for our Early Medieval civitates, ready to fit on a map. I loaded the CSV file in QGIS, added a background from Natural Earth, tweaked the labels and the map was ready. All done? Not really.

    Creating a dataset

    I want to have a small but solid dataset for this map, so I thought the best thing would be to find the corresponding Pleiades place. Pleiades has a blurred definition of Antiquity, but being a derivative of the Barrington Atlas there is very little Early Medieval knowledge in it. That’s where Regnum Francorum Online (RFO) comes in: thanks to the one-to-one mapping between places in RFO and Pleiades, I could look for the corresponding Pleiades URI for most places. In some cases, this is not possible (there is no RFO nor Pleiades place for Rota and Venice, yet, but I used Torcello as a convenient compromise for the latter) or it is difficult (as in the case of Smeldingorum, to be found in Germany without a more detailed location).

    Humans make mistakes. When the map was ready, I checked again that everything was in place. The combination of RFO and Pleiades was very helpful: for example, I mis-attributed Tarvisium to modern Tarvisio whereas in fact it is Treviso and I found out that Rota is not modern Roses but the smaller inland village of Roda de Ter (a detailed account of the siege is on the Catalan Viquipèdia).

    Here you can find the resulting dataset in CSV: civitates-arf.csv. It is in the public domain under Creative Commons Zero.

    There was an interactive map here when this article was originally published in 2012. I removed it since it didn’t work any more.