A few weeks ago the Total Open Station repository saw a burst of activity, when one blocking issue was finally solved, and that allowed me and the other contributors to release in a short cycle the long awaited 0.6 version, followed by the 0.7 version.
Version 0.6 is almost entirely the work of psolyca, who added full support for LandXML as both input and output format. The subset of LandXML that is supported is specifically targeted to survey data and we are looking forward to seeing reports from users in the field. There are many applications that are compatible with LandXML. During the 0.6 release cycle, the project adopted a code of conduct, the creation of a Windows portable app (click-and-run, even from a USB stick) was automated, as the continuous testing of the code.
Version 0.7 is a much simpler story. We switched to the new standard pyproject.toml configuration file for the project metadata, ensuring a cleaner development environment, and we added a variant of the existing CSV output format that is compatible with the LandSurveyCodesImport plugin for QGIS.
Speaking of QGIS, our contributor Enzo Cocca has created a beautiful plugin for using Total Open Station inside QGIS, with a dedicated interface for the same underlying functionality. For our next release, we have planned to bring some changes and new features that were added in the plugin repository, and align the version that is used (currently 0.5.3).
The homepage of the project is always at https://tops.iosa.it/ with links to the documentation and downloads. We will be happy to hear your reports and accept your contributions to the development of the software.
Starting today, you can install iosacal with conda. This adds to the existing installation procedure with pip. Conda is a good fit for complex projects and has better tooling for reproducibility.
Installing iosacal can be achieved by adding conda-forge to your channels with:
Google Colab is a popular notebook service that you can run directly from your browser. Python is natively supported and it’s fairly easy to run a Jupyter notebook, even with custom dependencies like Numpy and Matplotlib.
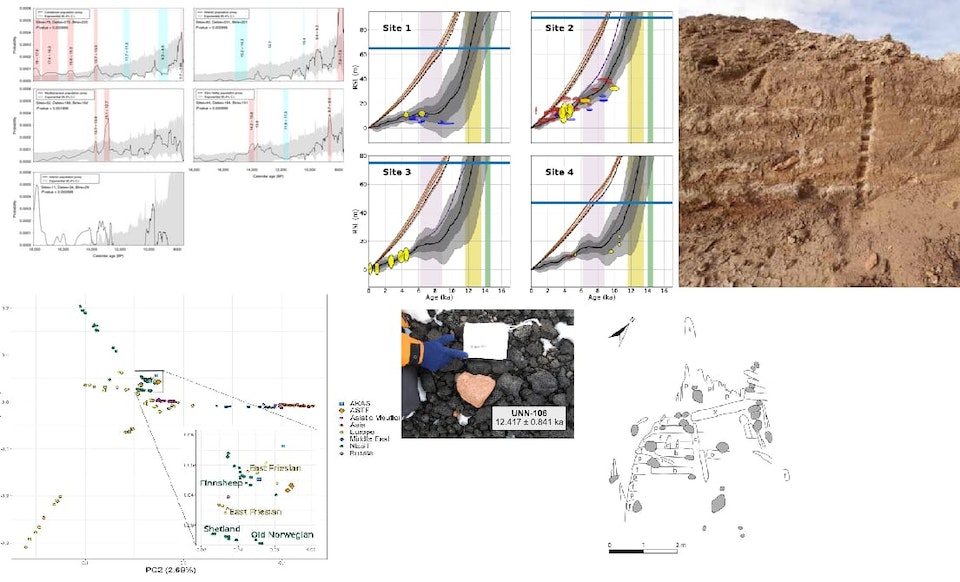
I have updated the documentation of iosacal with a new page that lists all research papers and case studies where the software gets a mention for being used.
A collage of figures from the papers using iosacal
It’s humbling to see this small piece of software find its way in so many research projects and I’m learning a lot by studying these publications.
Some authors contributed to iosacal with new features and bug fixes, and that is the most accurate metric of a healthy project that I can think of.
I’m going to add more useful content to the documentation as the main focus of the 0.7 release. In the meantime, you can continue using iosacal 0.6 in your research projects.
Gli atti del workshop Archeofoss 2022 sono stati pubblicati in open access su Archeologia e Calcolatori. Li trovate qui http://www.archcalc.cnr.it/journal/idyear.php?IDyear=2023-07-26 come numero 34.1 della rivista.
Ho curato insieme a Julian Bogdani l’edizione di questo volume ed è quindi motivo di soddisfazione, anche per i tempi rapidi con cui siamo arrivati alla pubblicazione grazie al lavoro collettivo degli autori e autrici, di chi ha fatto il referaggio, della redazione e della casa editrice.
Rimane una mancanza in questo volume rispetto alla ricchezza dei due giorni di incontro, delle sette sessioni tematiche, delle discussioni guidate da chi ha moderato le sessioni, ibride eppure vivacissime. La mancanza in parte è fisiologica ma in parte deriva da un certo numero di autrici e autori che non hanno presentato il proprio contributo per la pubblicazione. Ad esempio, nella sessione sui dati stratigrafici che ho moderato con Emanuel Demetrescu erano stati presentati 7 interventi ma solo 2 sono confluiti come paper nel volume.
Nei prossimi anni dovremo fare di più per fare in modo che gli atti raccolgano ancora più fedelmente il convegno.
A few weeks ago I presented a new version of the hmdp tool at the ARCHEOFOSS conference in Rome. You can find the archived presentation on Zenodo.
Harris Matrix Data Package is a proposal for a standardised digital format of archaeological stratigraphy datasets in CSV format, following the table schema developed by Thomas S. Dye for the hm Lisp package, augmented with a metadata descriptor (datapackage.json) that enables consistency checks and streamlined data access with the Frictionless Data tools and programming libraries. In the standard, each dataset consists of various CSV tables and a metadata descriptor, forming a data package. I proposed this standard in 2019 at a previous ARCHEOFOSS conference based on a 2015 work by Dye and Buck .
Based on this proposal, hmdp is a command line program for working with archaeological stratigraphy data in the Harris Matrix Data Package format.
The hmdp init command works both interactively and with explicit command line parameters, and it is centered around the idea that in the Harris Matrix Data Package:
each Harris Matrix is a data package
there is 1 data descriptor
there are from 2 to 7 CSV tables
each CSV table is a resource
The two resources that MUST be present are:
contexts
observations
Most often, excavation data will make use of three other resources:
inferences
periods
phases
Only in case there are radiocarbon dates or other absolute chronology available the two resources should be used:
events
event-order
With the above outline, default presets are defined, and choosing a preset will create the corresponding CSV files (resources). The CSV files are created only with the standard column headers, data must be filled by the user.
The current released version of hmdp init can create a Harris Matrix Data Package from scratch, e.g. in a new empty directory. Support for recognizing existing CSV files and adding the metadata descriptor is in progress.
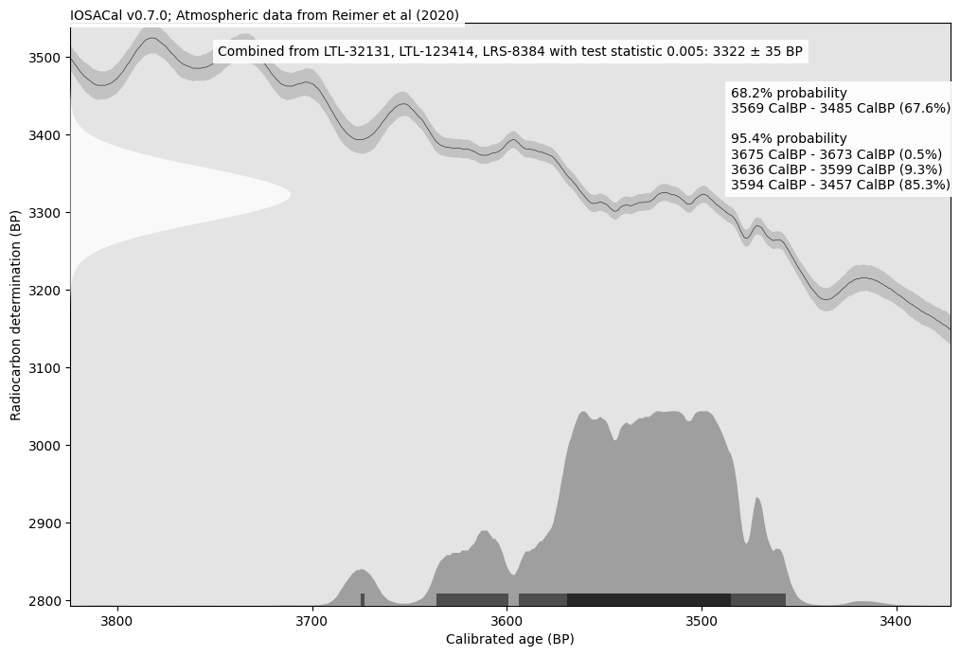
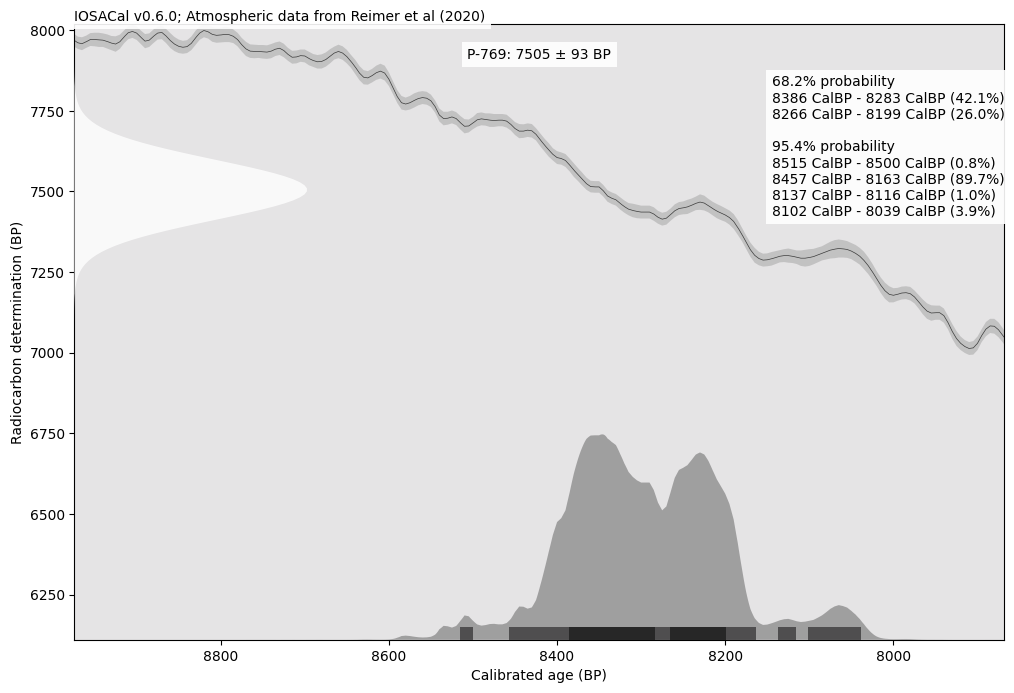
I’m happy to announce that IOSACal version 0.6 was released on October 1st, 2022.
IOSACal 0.6 brings new features for simulating radiocarbon dates and obtaining quantiles, added respectively by Hythem Sidky and Roger Creel, who both contributed to IOSACal for the first time. I want to thank both for their efforts to share improvements to the IOSACal source code by sticking to the code of conduct and contribution rules of the project.
The documentation at https://iosacal.readthedocs.io/ has been updated substantially, and some pages are now generated directly from Jupyter notebooks. You can download those notebooks and quickly start working on your own research notebooks.
You can get this update as usual with pip install iosacal or by updating your requirements.txt to this version:
iosacal==0.6.0
IOSACal 0.6 brings several improvements to the development process, most notably continuous integration (CI) thanks to Codeberg CI. All pull requests are automatically run through iosacal’s own test suite (coverage is not yet complete but it is improving). The detailed list of all changes is at https://iosacal.readthedocs.io/en/stable/whatsnew.html
The demo web application was discontinued, and usage with MyBinder or Google Colab is now encouraged.
As before, the preferred installation method is with pip in a virtual environment. The documentation is at https://iosacal.readthedocs.io/
This release brings the new IntCal20 calibration data and several improvements for different use cases, plus one important bug fix. Apart from myself, there were two contributors to this release, I’m grateful to Karl Håkansson and Wesley Weatherbee for their work.
These are the highlights from the release notes:
the project has moved to Codeberg for source code hosting and issue tracking. The new Git repository is at https://codeberg.org/steko/iosacal with a default branch name of main
there is an official Code of Conduct that all contributors (including the maintainter) will need to follow, based on Contributor Covenant
the documentation has seen some improvements, in particular in the Contributing section. Overall, making contributions easier from both expert and novice users is a major theme in this release.
interactive use in Jupyter notebooks is made easier with CalibrationCurve that can be created in many ways (such as loading from an arbitrary file, or from a standard calibration curve called by shorthand)
fixed a bug that made plots with AD/CE setting incorrect (contributed by Karl Håkansson)
fixed a bug that caused a wrong plot density function for dates 80 BP to 0 BP (contributed by Karl Håkansson)
add IntCal20 calibration data (contributed by Wesley Weatherbee)
On the technical side:
the command line interface is now based on the Click library
most code is now covered by tests, based on pytest
Python 3.6 or above required
requires Numpy 1.18 and Matplotlib 3.0
I don’t have big plans for the next release. I would like to add more tests, modernize the code and make it easier to adapt / tinker with. The only major achievement I’m looking forward to is to submit an article about IOSACal to the Journal of Open Source Software.
Lo scorso 12 dicembre ho organizzato e presentato un evento in diretta streaming dedicato alla villa romana di Bussana, uno dei siti archeologici più conosciuti di Sanremo.
La “locandina” dell’evento
Non mi sono mai occupato nello specifico di questo sito quindi ho pensato di coinvolgere altri colleghi, persone che hanno svolto ricerche e scavi, che hanno lavorato nel contesto paesaggistico circostante. Tutto è stato composto sotto forma di una lunga diretta di oltre tre ore e mezza, in cui ho presentato gli interventi registrati, incluse due visite virtuali, intervallate dai miei commenti e dalle risposte alle domande del pubblico, soprattutto nella seconda parte.
In questi lunghi mesi di pandemia e lockdown ho partecipato come tanti (anche se certamente non tutti, sia chiaro) a svariate videoriunioni, ho creato contenuti registrati per la diffusione da parte di istituzioni culturali e ho anche tenuto una lezione universitaria. Ma erano tutte situazioni con attori ben precisi, anche quando solo spettatori. Con l’evento dedicato alla villa di Bussana per la prima volta ho sperimentato il parlare al pubblico in diretta digitale. Parlare in pubblico è per me un fatto non quotidiano ma accade regolarmente, in particolare per conferenze e visite guidate. In questo caso la vera complicazione è stato improvvisarsi anche regista e presentatore.
La diretta streaming è stata trasmessa sulla pagina Facebook della Soprintendenza: chi mi conosce da più tempo sa che non ho più un account Facebook da molti anni e che non apprezzo nessuno dei social network proprietari che hanno così tanto peso nelle nostre vite. Tuttavia, attualmente il MiBACT segue semplicemente le abitudini comuni a tutte le pubbliche amministrazioni e istituzioni culturali, addirittura elevando a sistema la moltitudine di profili social su un nuovo portale dedicato ‒ CulturaItaliaOnline ‒ realizzato “per aggregare in un unico luogo i contenuti Social pubblicati dalle principali istituzioni culturali italiane sui propri account”. I servizi contemplati sono unicamente Facebook, Instagram e Youtube.
Quando è venuto il momento di decidere se annullare del tutto la visita guidata prevista oppure trasformarla in un evento digitale, avevo già fatto qualche prova con OBS Studio, il programma che consente di organizzare contenuti di tipi diversi e trasmettere in diretta streaming su Facebook, Youtube e molti altri servizi. OBS Studio ha molte funzionalità ed è abbastanza intuitivo, quindi permette di trasformarsi in “registi” improvvisati senza troppe difficoltà. La mia apparecchiatura domestica non era delle migliori ma tutto sommato è stata accettabile. L’inesperienza mi ha portato a sopravvalutare l’utilità della mia connessione ultraveloce, senza tenere conto della scarsa potenza del mio computer, che ha reso scarsa la qualità del video in alcuni momenti, soprattutto mentre stavo trasmettendo video registrati e contemporaneamente seguendo la diretta streaming per verificare che tutto funzionasse a dovere. La latenza di circa 30 secondi ha causato alcuni momenti di “buio” o di parlato tagliato. Non sono riuscito a trovare un modo efficace per ascoltare i contenuti registrati all’interno di OBS in modo da seguire in modo più preciso la fine delle scene preparate e il ritorno alla diretta.
Quindi la prossima volta, se possibile, dovrebbero essere due persone a occuparsi della diretta (forse nemmeno fisicamente nello stesso posto) in modo che non sia necessario sovraccaricare una singola postazione. Una scheda video dedicata avrebbe comunque migliorato di molto le prestazioni di transcodifica in diretta, e forse anche la conversione dei video registrati in formati più adatti avrebbe aiutato.
Stanno iniziando a funzionare strumenti liberi per lo streaming indipendente dalle grandi piattaforme, come owncast o Peertube 3.0. Questo è sicuramente uno sviluppo interessante, anche perché si possono comunque usare i social mass media come cassa di risonanza per la promozione senza per questo tenere il contenuto in diretta sui loro spazi e sui loro archivi capienti ma smemorati – vi sfido infatti anche a distanza di pochi giorni a trovare la registrazione se non ne conoscete l’esistenza. Per il momento potete rivedere la registrazione della diretta a questo indirizzo:
Il buon successo della diretta e delle visualizzazioni successive (ad oggi oltre 800) mi fa ovviamente pensare che ci sia grande bisogno di questo formato di comunicazione diretto e umano, certamente più coinvolgente di una conferenza anche se molto meno approfondito, a maggior ragione quando le conferenze si svolgono dentro un’area archeologica.