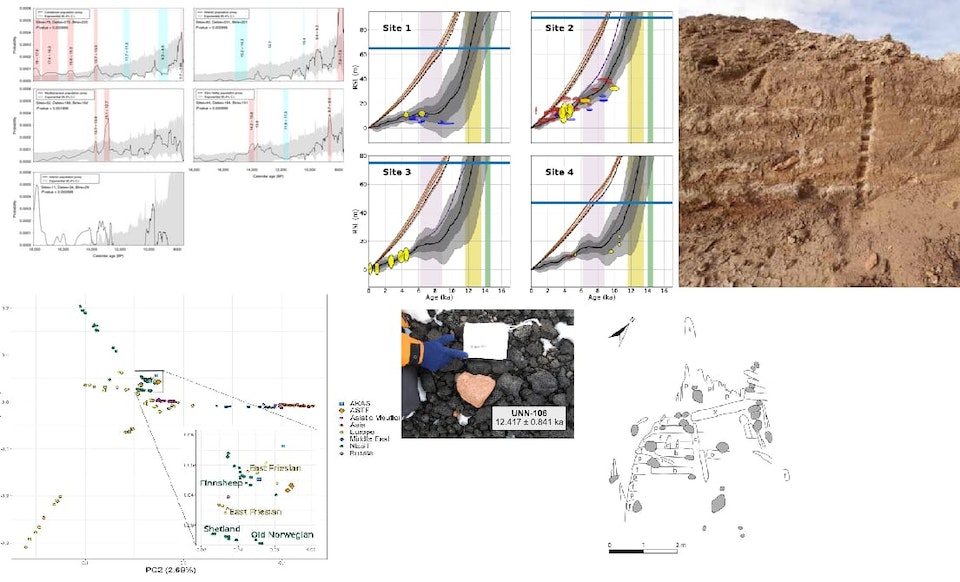
I have updated the documentation of iosacal with a new page that lists all research papers and case studies where the software gets a mention for being used.
A collage of figures from the papers using iosacal
It’s humbling to see this small piece of software find its way in so many research projects and I’m learning a lot by studying these publications.
Some authors contributed to iosacal with new features and bug fixes, and that is the most accurate metric of a healthy project that I can think of.
I’m going to add more useful content to the documentation as the main focus of the 0.7 release. In the meantime, you can continue using iosacal 0.6 in your research projects.
Today marks the 18th anniversary of IOSA, Internet and Open Source in Archaeology, the project/working group that I got started with Giovanni Luca Pesce in 2004. Luca Bianconi would join a few years later and give a substantial contribution to the development of the oldest active software project under the IOSA umbrella, Total Open Station.
It seems an appropriate time to announce that the iosa.it website is now available with a revamped look, and has become the single container for all content previously available in separate websites, such as the Quantitative Archaeology Wiki.
There will be no substantial improvements to the website, but I consider it a “living archive” so I’m going to add more content as I find it and have the time to organize it properly.
Please find it at https://www.iosa.it/ as usual, and browse like it’s 2004 again.
After serving for 7 years as the co-editor of the journal together with Victoria Yorke-Edwards, I have chosen to step down from my role as editor, while remaining on the Editorial Board. I had been on the Editorial Board before.
Recently I have become rather busy with work and family commitments, with only a minor involvement in academic archaeology to guarantee the time and effort that is required for running JOAD. To ensure that JOAD continues to be successful, this decision was necessary. This announcement arrives after one year of transition – we did not abandon the ship and continued publishing open archaeology datasets.
The new editors, Alessio Palmisano and Carmen Ting, will bring forward the journal’s mission with support from Anastasia Sakellariadi who has taken the very important role of editorial manager for the journal at Ubiquity Press.
As I look back to the past few years, the global scenario of open research data has changed a lot, becoming both more and more common but also more integrated with other facets of the broader open science movement, in archaeology too.
I think JOAD has a tremendous potential to improve all archaeological disciplines as an open science good practice. The peer review process is almost always a chance for authors to improve their work and the datasets they are about to publish, thanks to the many reviewers that volunteered to foster our activity. You can register now to become a reviewer in your field of specialization.
There are now other data journals that, while missing the specificity on archaeology, are geared towards a systematic habit of data sharing via data descriptor papers. This is both a challenge to the idea of a specific journal for each disciplinary field (something that mega-journals partly achieved, in the footsteps of PLOS One) and a big move towards open access publishing for research data, whatever the actual planwe choose to get there. I am convinced that the Journal of Open Archaeology Data will play its role even in this changed environment.
Il 20 febbraio 2019, a Padova, tengo un workshop su Reproducible science per archeologi dentro il convegno FOSS4G-IT 2019. Avete tempo fino a mercoledì 13 febbraio per iscrivervi.
Cosa facciamo
Questo workshop guida i partecipanti nella creazione di una analisi di dati archeologici, secondo i canoni della reproducible science sempre più diffusi a livello internazionale e trasversale.
Utilizzando software di elaborazione ben noti come il linguaggio R e l’ambiente di programmazione RStudio, partiremo da alcuni dataset e affronteremo i vari passaggi analitici che vengono trasposti sotto forma di codice: è una procedura pensata per rendere esplicito il processo di ricerca con i suoi meccanismi di tentativi ed errori, secondo il principio della ripetibilità sperimentale.
I partecipanti potranno intervenire attivamente con me nella definizione del percorso e del prodotto finale del workshop, esplorando le pratiche più attuali della open science archeologica diffuse a livello internazionale.
Ci colleghiamo ad altri workshop svolti negli anni scorsi negli USA da Ben Marwick e Matt Harris.
Come iscriversi
Vi potete registrare fino al 13 febbraio 2019 su questa pagina http://foss4g-it2019.gfoss.it/registrazione
Per l’iscrizione è richiesto un pagamento di 10 € che vanno a coprire i costi organizzativi dell’evento – non serve a pagare il sottoscritto.
Letture e riferimenti
Per partecipare servirà avere installato R, RStudio e se possibile anche Git:
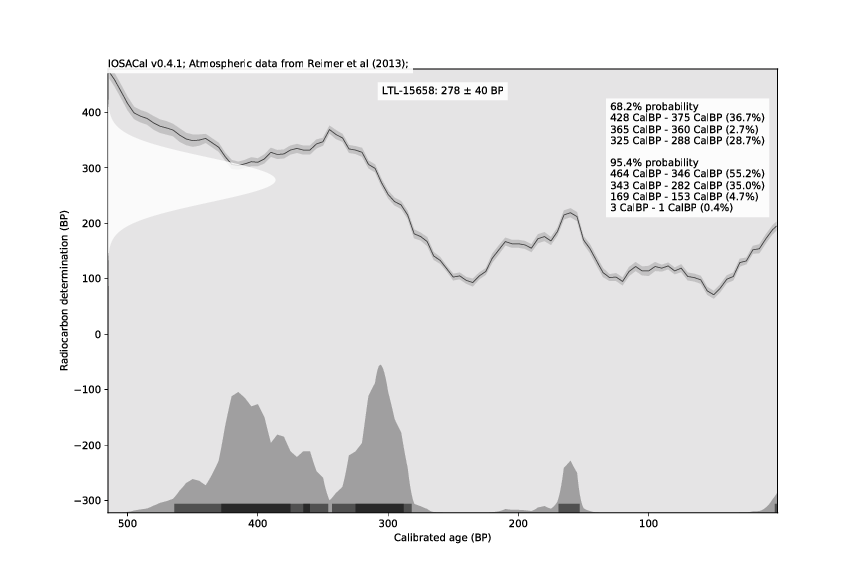
IOSACal is an open source program for calibration of radiocarbon dates.
A few days ago I released version 0.4, that can be installed from PyPI or from source. The documentation and website is at http://c14.iosa.it/ as usual. You will need to have Python 3 already installed.
The main highlight of this release are the new classes for summed probability distributions (SPD) and paleodemography, contributed by Mario Gutiérrez-Roig as part of his work for the PALEODEM project at IPHES.
A bug affecting calibrated date ranges extending to the present was corrected.
On the technical side the most notable changes are the following:
requires NumPy 1.14, SciPy 1.1 and Matplotlib 2.2
removed dependencies on obsolete functions
improved the command line interface
You can cite IOSACal in your work with the DOI https://doi.org/10.5281/zenodo.630455. This helps the author and contributors to get some recognition for creating and maintaining this software free for everyone.
Last week a tweet from the always brilliant Jolene Smith inspired me to write down my thughts and ideas about numbering boxes of archaeological finds. For me, this includes also thinking about the physical labelling, and barcodes.
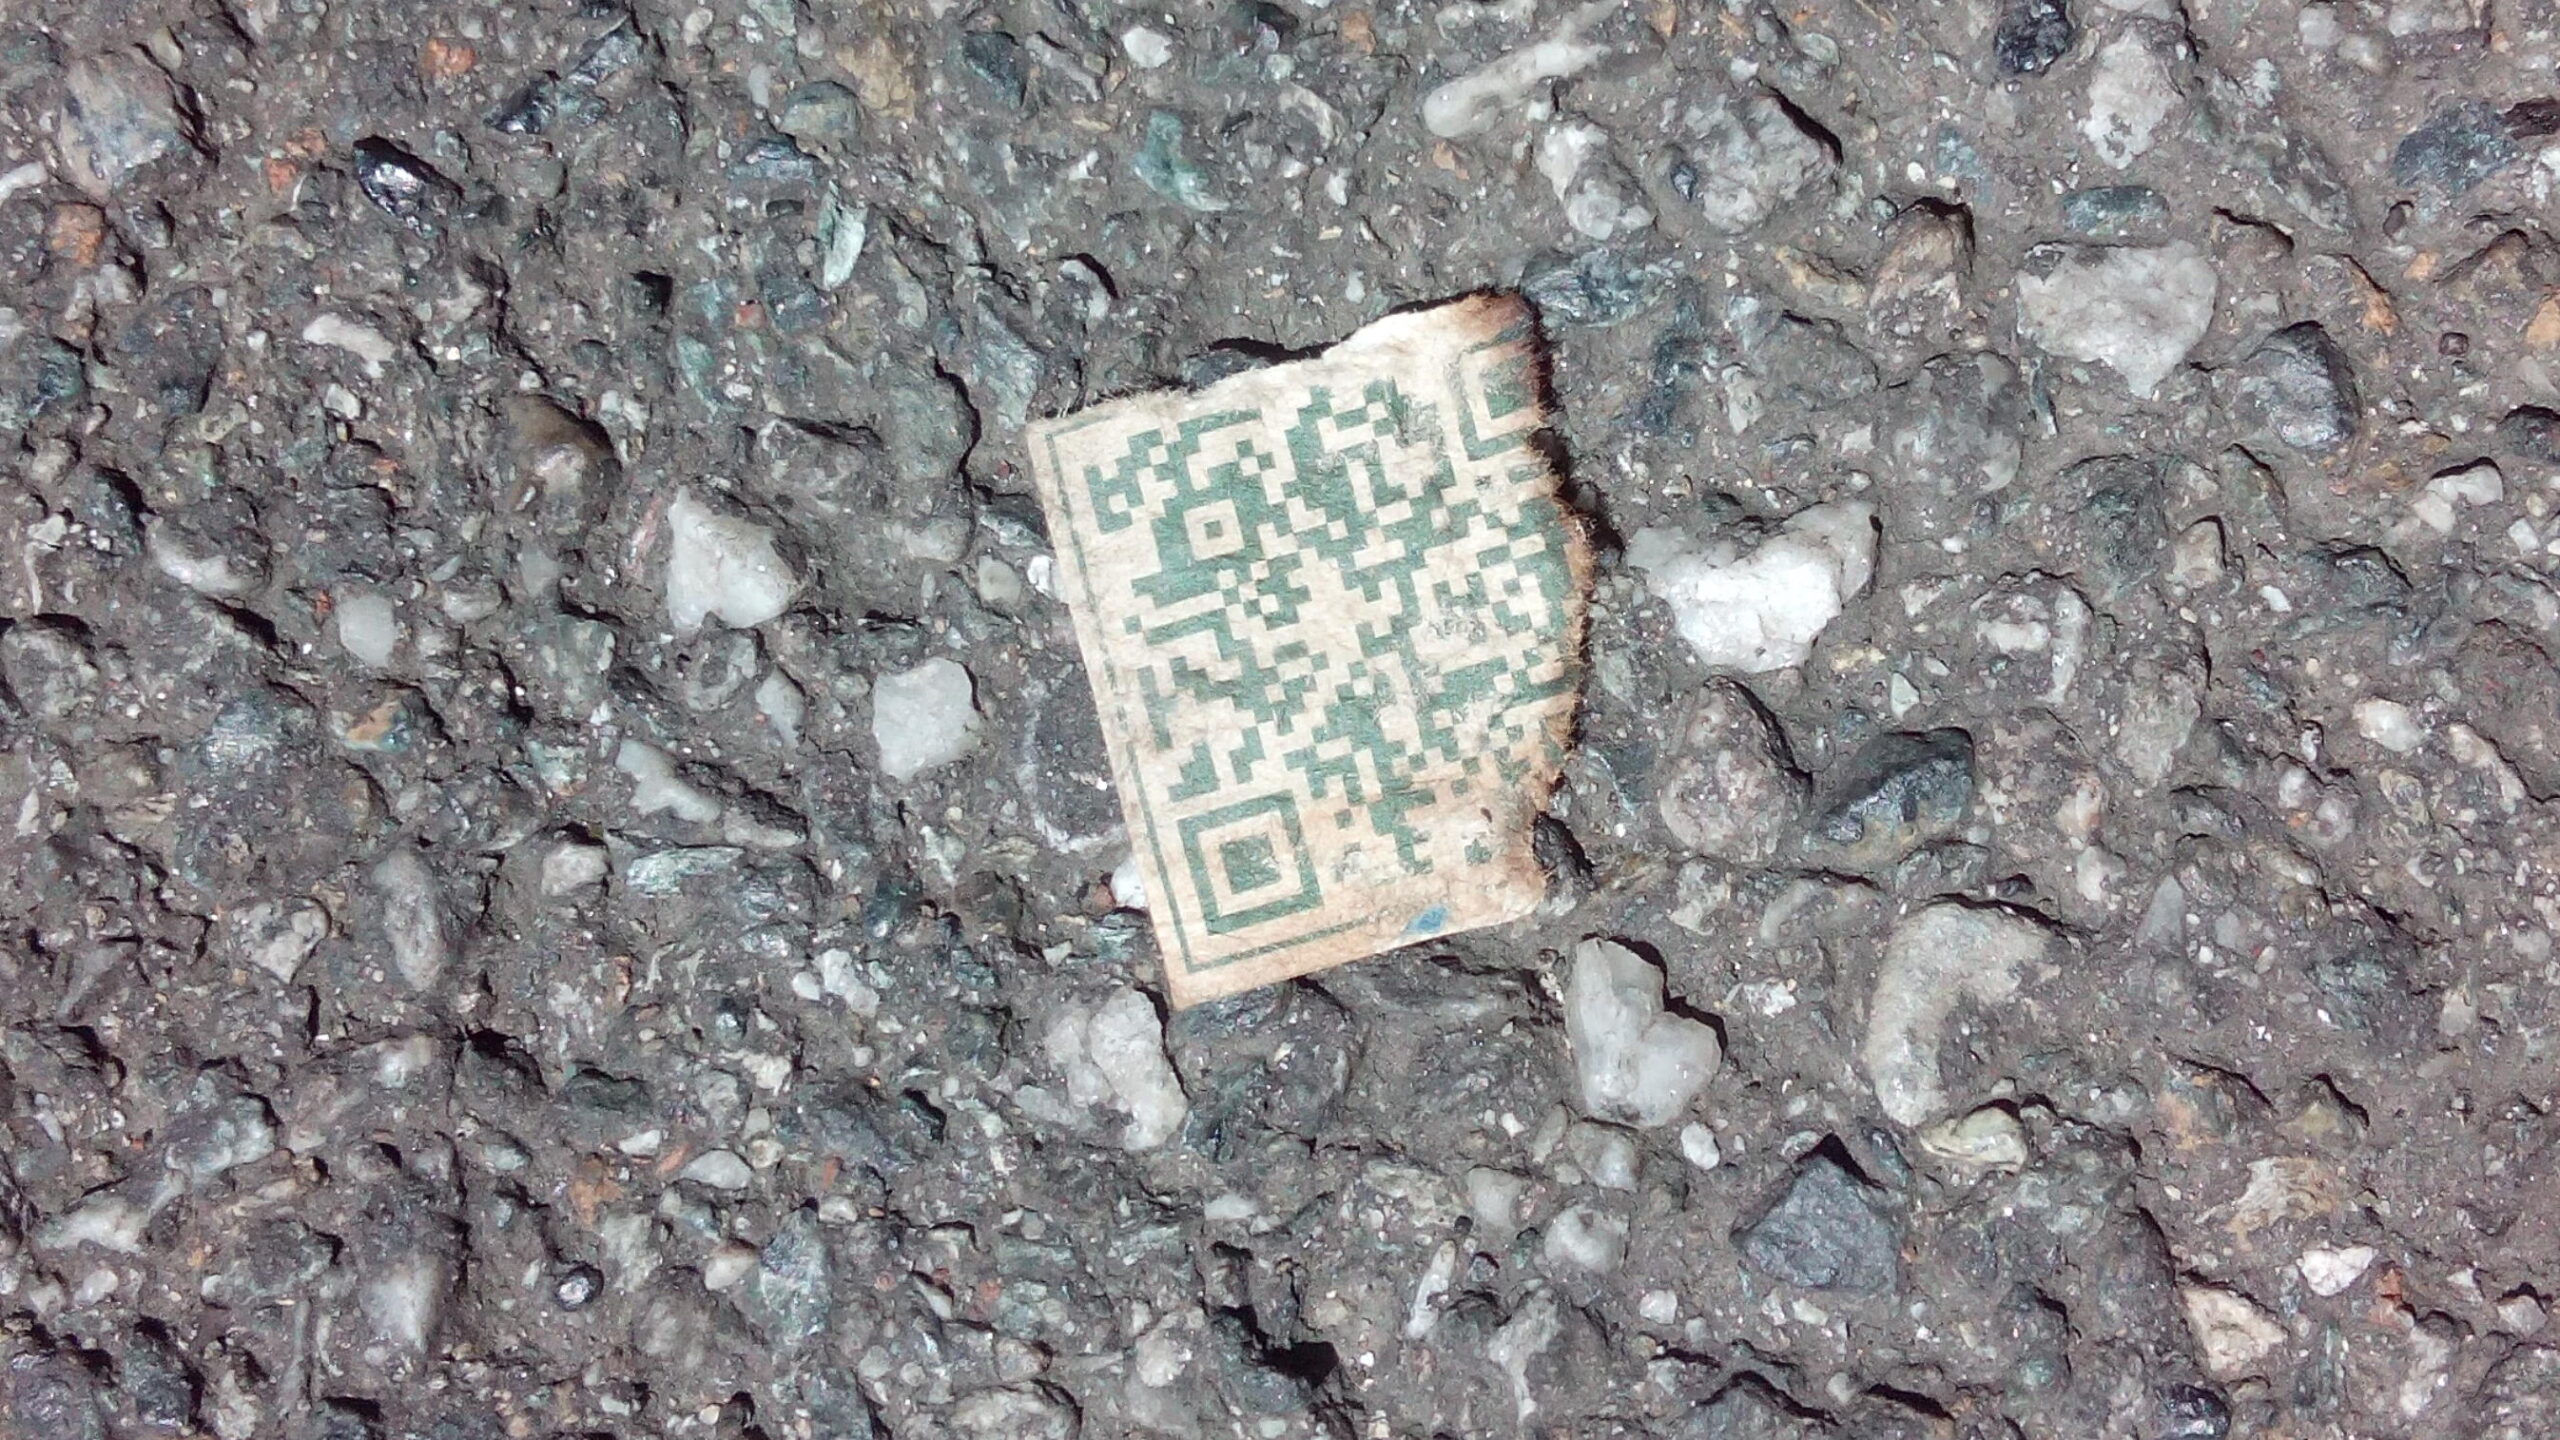
The question Jolene asks is: should I use sequential or random numbering? To which many answered: use sequential numbering, because it bears significance and can help detecting problems like missing items, duplicates, etc. Furthermore, if the number of items you need to number is small (say, a few thousands), sequential numbering is much more readable than a random sequence. Like many other archaeologists faced with managing boxes of items, I have chosen to use sequential numbering in the past. With 200 boxes and counting, labels were easily generated and each box had an associated web page listing the content, with a QR code providing a handy link from the physical label to the digital record. This numbering system was put in place during 3 years of fieldwork in Gortyna and I can say that I learned a few things in the process. The most important thing is that it’s very rare to start from scratch with the correct approach: boxes were labeled with a description of their content for 10 years before I adopted the numbering system pictured here. This sometimes resulted in absurdly long labels, easily at risk of being damaged, difficult to search since no digital recording was made. I decided a numbering system was needed because it was difficult to look for specific items, after I had digitised all labels with their position in the storage building (this often implied the need to number shelves, corridors, etc.). The next logical thing was therefore to decouple the labels from the content listing ‒ any digital tool was good here, even a spreadsheet. Decoupling box number from description of content allowed to manage the not-so-rare case of items moved from one box to another (after conservation, or because a single stratigraphic context was excavated in multiple steps, or because a fragile item needs more space …), and the other frequent case of data that is augmented progressively (at first, you put finds from stratigraphic unit 324 in it, then you add 4.5 kg of Byzantine amphorae, 78 sherds of cooking jars, etc.). Since we already had a wiki as our knowledge base, it made sense to use that, creating a page for each box and linking from the page of the stratigraphic unit or that of the single item to the box page (this is done with Semantic MediaWiki, but it doesn’t matter). Having a URL for each box I could put a QR code on labels: the updated information about the box content was in one place (the wiki) and could be reached either via QR code or by manually looking up the box number. I don’t remember the details of my reasoning at the time, but I’m happy I didn’t choose to store the description directly inside the QR code ‒ so that scanning the barcode would immediately show a textual description instead of redirecting to the wiki ‒ because that would require changing the QR code on each update (highly impractical), and still leave the information unsearchable. All this is properly documented and nothing is left implicit. Sometimes you will need to use larger boxes, or smaller ones, or have some items so big that they can’t be stored inside any container: you can still treat all of these cases as conceptual boxes, number and label them, give them URLs.
QR codes used for boxes of archaeological items in Gortyna
There are limitations in the numbering/labelling system described above. The worst limitation is that in the same building (sometimes on the same shelf) there are boxes from other excavation projects that don’t follow this system at all, and either have a separate numbering sequence or no numbering at all, hence the “namespacing” of labels with the GQB prefix, so that the box is effectively called GQB 138 and not 138. I think an efficient numbering system would be one that is applied at least to the scale of one storage building, but why stop there?
Turning back to the initial question, what kind of numbering should we use? When I started working at the Soprintendenza in Liguria, I was faced with the result of no less than 70 years of work, first in Ventimiglia and then in Genoa. In Ventimiglia, each excavation area got its “namespace” (like T for the Roman theater) and then a sequential numbering of finds (leading to items identified as T56789) but a single continuous sequential sequence for the numbering of boxes in the main storage building. A second, newer building was unfortunately assigned a separate sequence starting again from 1 (and insufficient namespacing). In Genoa, I found almost no numbering at all, despite (or perhaps, because of) the huge number of unrelated excavations that contributed to a massive amount of boxes. Across the region, there are some 50 other buildings, large and small, with boxes that should be recorded and accounted for by the Soprintendenza (especially since most archaeological finds are State property in Italy). Some buildings have a numbering sequence, most have paper registries and nothing else. A sequential numbering sequence seems transparent (and allows some neat tricks like the German tanks problem), since you could potentially have an ordered list and look up each number manually, which you can’t do easily with a random number. You also get the impression of being able to track gaps in a sequence (yes, I do look for gaps in numeric sequences all the time), thus spotting any missing item. Unfortunately, I have been bitten too many times by sequential numbers that turned out to have horrible bis suffixes, or that were only applied to “standard” boxes leaving out oversized items.
On the other hand, the advantages of random numbering seem to increase linearly with the number of separate facilities ‒ I could replace random with non-transparent to better explain the concept. A good way to look at the problem is perhaps to ask whether numbering boxes is done as part of a bookkeeping activity that has its roots in paper registries, or it is functional to the logistics of managing cultural heritage items in a modern and efficient way.
Logistics. Do FedEx, UPS, Amazon employees care what number sequence they use to track items? Does the cashier at the supermarket care whether the EAN barcode on your shopping items is sequential? I don’t know, but I do know that they have a very efficient system in place, in which human operators are never required to actually read numerical IDs (but humans are still capable of checking whether the number on the screen is the same as the one printed on the label). There are many types of barcode used to track items, both 1D and 2D, all with their pros and cons. I also know of some successful experiments with RFID for archaeological storage boxes (in the beautiful depots at Ostia, for example), that can record numbers up to 38 digits.
Based on all the reflections of the past years, my idea for a region- or state-wide numbering+labeling system is as follows (in RFC-style wording):
it MUST use a barcode as the primary means of reading the numerical ID from the box label
the label MUST contain both the barcode and the barcode content as human-readable text
it SHOULD use a random numeric sequence
it MUST use a fixed-length string of numbers
it MUST avoid the use of any suffixes like a, b, bis
In practice, I would like to use UUID4 together with a barcode.
A UUID4 looks like this: 1b08bcde-830f-4afd-bdef-18ba918a1b32. It is the UUID version of a random number, it can be generated rather easily, works well with barcodes and has a collision probability that is compatible with the scale I’m concerned with ‒ incidentally I think it’s lower than the probability of human error in assigning a number or writing it down with a pencil or a keyboard. The label will contain the UUID string as text, and the barcode. There will be no explicit URL in the barcode, and any direct link to a data management system will be handled by the same application used to read the barcode (that is, a mobile app with an embedded barcode reader). The data management system will use UUID as part of the URL associated with each box. You can prepare labels beforehand and apply them to boxes afterwards, recording all the UUIDs as you attach the labels to the boxes. It doesn’t sound straightforward, but in practice it is.
And since we’re deep down the rabbit hole, why stop at the boxes? Let’s recall some of the issues that I described non-linearly above:
the content of boxes is not immutable: one day item X is in box Y, the next day it gets moved to box Z
the location of boxes is not immutable: one day box Y is in room A of building B, the next day it gets moved to room C of building D
both #1 and #2 can and will occur in bulk, not only as discrete events
The same UUIDs can be applied in both directions in order to describe the location of each item in a large bottom-up tree structure (add as many levels as you see fit, such as shelf rows and columns):
and since we would have already built our hypothetical data management system, this data is filled into the system just by scanning two barcodes on a mobile device that will sync as soon as a connection is available. Moving one box to another shelf is again a single operation, despite many items actually moved, because the leaves and branches of the data tree are naïve and only know about their parents and children, but know nothing about grandparents and siblings.
There are a few more technical details about data structures needed to have a decent proof of concept, but I already wrote down too many words that are tangential to the initial question of how to number boxes.
Today marks five years since Tiziano Mannoni passed away.
There’s one thing that always characterised his work in publications and lectures: a need to visualise anything from research processes to production processes and complex human-environment systems in a schematic, understandable way. The most famous of such diagrams is perhaps the “material culture triangle” in which artifacts, behaviors and significants are the pillars on which archaeology is (or should be) based.
As a student, I was fascinated by those drawings, to the point of trying myself to create new ones. In 2012, in a rare moment of lucidity, I composed the diagram below trying to put together several loosely-related activities I had been doing in the previous years. Not much has changed since then, but it’s interesting to look back at some of the ideas and the tools.
Kotyle is the name I gave to a prototype tool and data format for measurements of the volume/capacity of ceramic vessels. The basic idea is to make volume/capacity measurement machine-readable and allow for automated measurements from digital representations of objects (such as SVG drawings). Some of the ideas outlined for Kotyle are now available in a usable form from the MicroPasts project, with the Amphora Profiling tool (I’m not claiming any credit over the MicroPasts tool, I just discussed some of the early ideas behind it). Kotyle is proudly based on Pappus’s theorems and sports Greek terminology whenever it can.
SVG drawings of pottery are perhaps the only finalised item in the diagram. I presented this at CAA 2012 and the paper was published in the proceedings volume in 2014. In short: stop using [proprietary format] and use SVG for your drawings of pots, vases, amphoras, dishes, cups. If you use SVG, you can automatically extract geometric data from your drawings ‒ and maybe calculate the capacity of one thousand different amphoras in 1 second. Also, if you use SVG you can put links to other archaeological resources such as stratigraphic contexts, bibliographic references, photographs, production sites etc directly inside the drawing, by means of metadata and RDFa.
Linked Open Archaeological Data (with the fancy LOAD acronym) is without doubt the most ambitious idea and ‒ unsurprisingly ‒ the least developed. Based on my own experience with studying and publishing archaeological data from excavation contexts, I came up with a simplified (see? I did this more than once) ontology, building on what I had seen in ArchVocab (by Leif Isaksen), that would enable publication of ceramic typologies and type-series on the Web, linked to their respective bibliographic references, their production centres (Pleiades places, obviously) and then expand this to virtually any published find, context, dig, site. Everything would be linked, machine-readable and obviously open. Granularity is key here, and perhaps the only thing that is missing (or could be improved) in OpenContext. A narrow view of what it may look like for a single excavation project is GQBWiki. I don’t see anything similar to LOAD happening in the near future however, so I hope stating its virtual existence can help nurture further experiments in this direction.
The original case study for LOAD is ARSILAI: African Red Slip in Late Antique Italy, that is my master’s thesis. The web-based application I wrote in Django naturally became the inspiration for creating a published resource that could have been constantly updated, based on feedback and contributions from the many scholars in the field of late Roman pottery. Each site, dig, context, sherd family, sherd type, ware has a clean URI, with sameAs links where available (e.g. sites can be Pleiades places, digs can be FastiOnLine records). Bibliographic references are just URIs of Zotero resources, since creating bibliographic databases from scratch is notoriously a bad idea. In 2012 I had this briefly online using an AWS free tier server, but since then I have never had again the time to deploy it somewhere (in the meantime, the release lifecycle of Django and other dependencies means I need to upgrade parts of my own source code to make it run smoothly again). One of the steps I had taken to make the web application less resource-hungry when running on a web server was to abandon Matplotlib (which I otherwise love and used extensively) and create the plots of chronology distribution with a Javascript library, based on JSON data: the server will just create a JSON payload from the database query instead of a static image resulting from Matplotlib functions. GeoJSON as alternate format for sites was also a small but useful improvement (and it can be loaded by mapping libraries such as Leaflet and OpenLayers). One of the main aims of ARSILAI was to show the geospatial distribution of African Red Slip ware, with the relative and absolute quantities of finds. Quantitative data is the actual focus of ARSILAI, with all the implications of using sub-optimal “data” from literature, sometimes 30 years old (but, honestly, most current publications of ceramic contexts are horrible at providing quantitative data).
So the last item in the “digital approaches to archaeological pottery” toolbox is statistics. Developing open source function libraries for R and Python that deal with commonly misunderstood methods like estimated vessel equivalents and their statistical counterpart, pottery information equivalents (pie-slices). Collect data from bodysherds with one idea (assessing quantity based on volume of pottery, that I would calculate from weight and thickness sherd-by-sherd) just to find out an unintended phenomenon that I think was previously unknown (sherd weight follows a log-normal or power-law distribution, at any scale of observation) Realise that there is not one way to do things well, but rather multiple approaches to quantification based on what your research question is, including the classic trade networks but also depositional histories and household economics. At this point, it’s full circle. The diagram is back at square one.
Earlier this year, in cold January morning commutes, I finally read William Gibson’s masterpiece trilogy. If you know me personally, this may sound ironic, because I dig geek culture quite a bit. Still, I’m a slow reader and I never had a chance to read the three books before. Which was good, actually, because I could enjoy them deeply, without the kind of teenage infatuation that is quickly gone ‒ and most importantly because I could read the original books, instead of a translation: I don’t think 15-year old myself could read English prose, not Gibson’s prose at least, that easily.
I couldn’t help several moments of excitement for the frequent glimpses of archaeology along the chapters. This could be a very naive observation, and maybe there are countless critical studies that I don’t know of, dealing with the role of archaeology in the Sprawl trilogy and Gibson’s work in general. Perhaps it’s touching for me because I deal with Late Antiquity, that is the closest thing to a dystopian future that ever happened in the ancient world, at least as we see it with abundance of useless objects and places from the past centuries of grandeur. Living among ruins of once beautiful buildings, living at the edge of society in abandoned places, reusing what was discarded in piles, black markets, spirituality: it’s all so late antique. Of course the plot of the Sprawl trilogy is a contemporary canon, and the characters are post-contemporary projections of a (very correctly) imagined future, but the setting is, to me, evoking of a world narrative that I could embrace easily if I had to write fiction about the periods I study.
Count Zero is filled with archaeology, of course especially the Marly chapters. Towards the end it gets more explicit, but it’s there in almost all chapters and it has something to do with the abundance of adjectives, the care for details in little objects. Mona Lisaoverdrive is totally transparent about it, since the first pages of Angie Mitchell on the beach:
The house crouched, like its neighbors, on fragments of ruined foundations, and her walks along the beach sometimes involved attempts at archaeological fantasy. She tried to imagine a past for the place, other houses, other voices.
– William Gibson. Mona Lisa Overdrive, p. 35.
But really, you just have to follow Molly along the maze of the Straylight Villa in Neuromancer to realize it’s a powerful theme of all the Sprawl trilogy.
The Japanese concept of gomi, that pervades Kumiko’s view of Britain and the art of Rubin in the Winter Market, is another powerful tool for material culture studies, at least if we have to find a pop dimension where our studies survive beyond the inevitable end of academia.
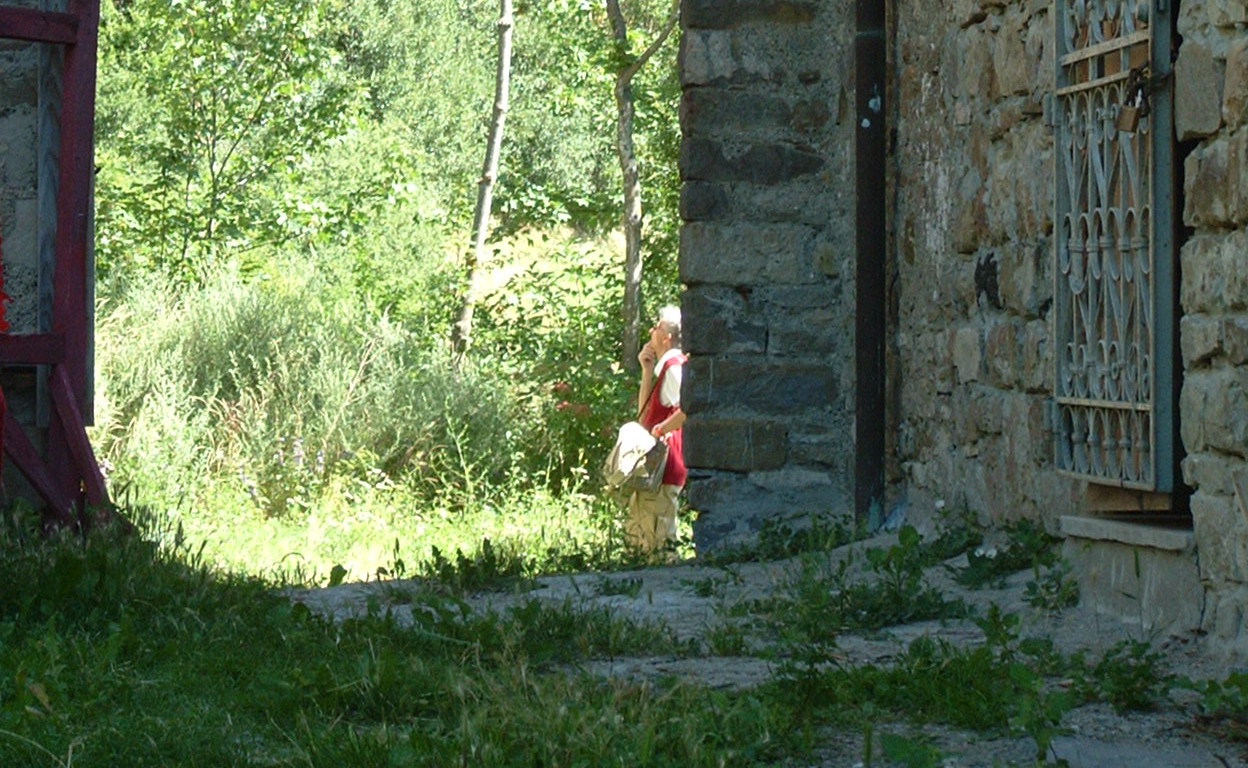
Friday 17th July is the last day at work in this short GQB 2015 field campaign. I’m still a bit exhausted from the return trip to Rethymno, but most importantly I’m very satisfied with the exchange of ideas about various topics (Early Byzantine fortifications, water supply systems, pottery, exploitation of natural and agricultural resources) that we had.
Since my main task here was to work on the analysis of ceramic contexts, I just continued my writing of text and R source code as in the past days. In the late afternoon we left to pay a short visit to the village of Panagia where we found an old water fountain that is depicted in a 100-years old photograph. It’s strange, photographs seem to tell true stories, so direct ‒ whereas in fact they’re a paradigmatic form of mediation. Sometimes, when you need to get a better understanding of an object, it’s useful to look at it from different angles, at different scales, alone or in its natural context, under a microscope or in your bare hands. I think that’s what I’m trying to do with the ceramic contexts from the Byzantine District of Gortyna: it’s not always easy and of course it’s not always working because I lack the archaeological, statistical, petrographic, drawing skills that would be needed to make this “prism” fully working. However, I am convinced that the result is worth the trade-offs, and there will be room for improvement of the details at a later stage. For now, I just go on iterating, half artificial intelligence algorithm and half craftsman.
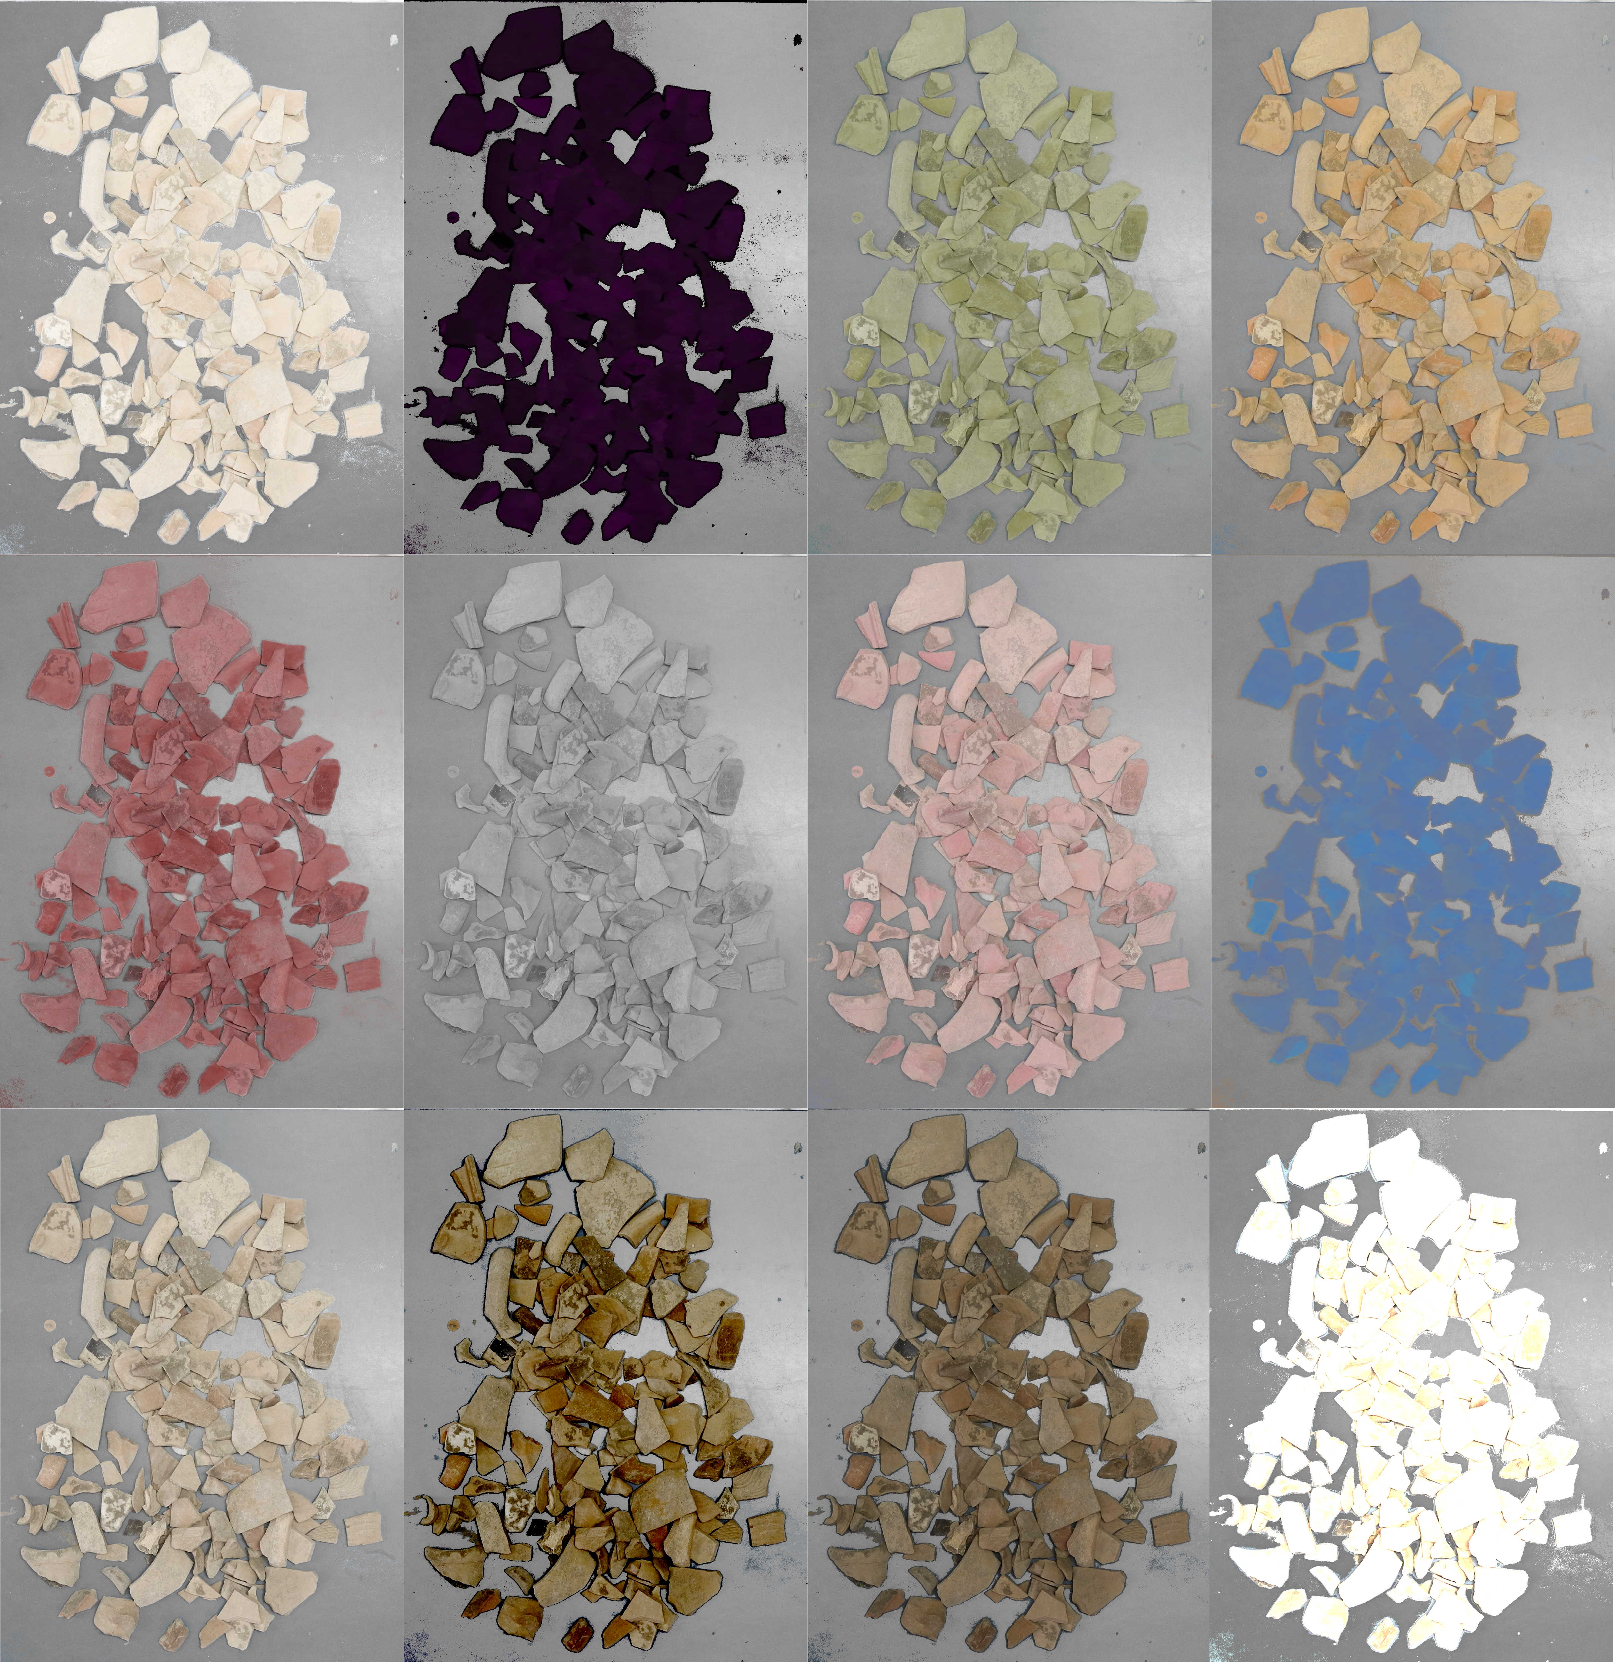
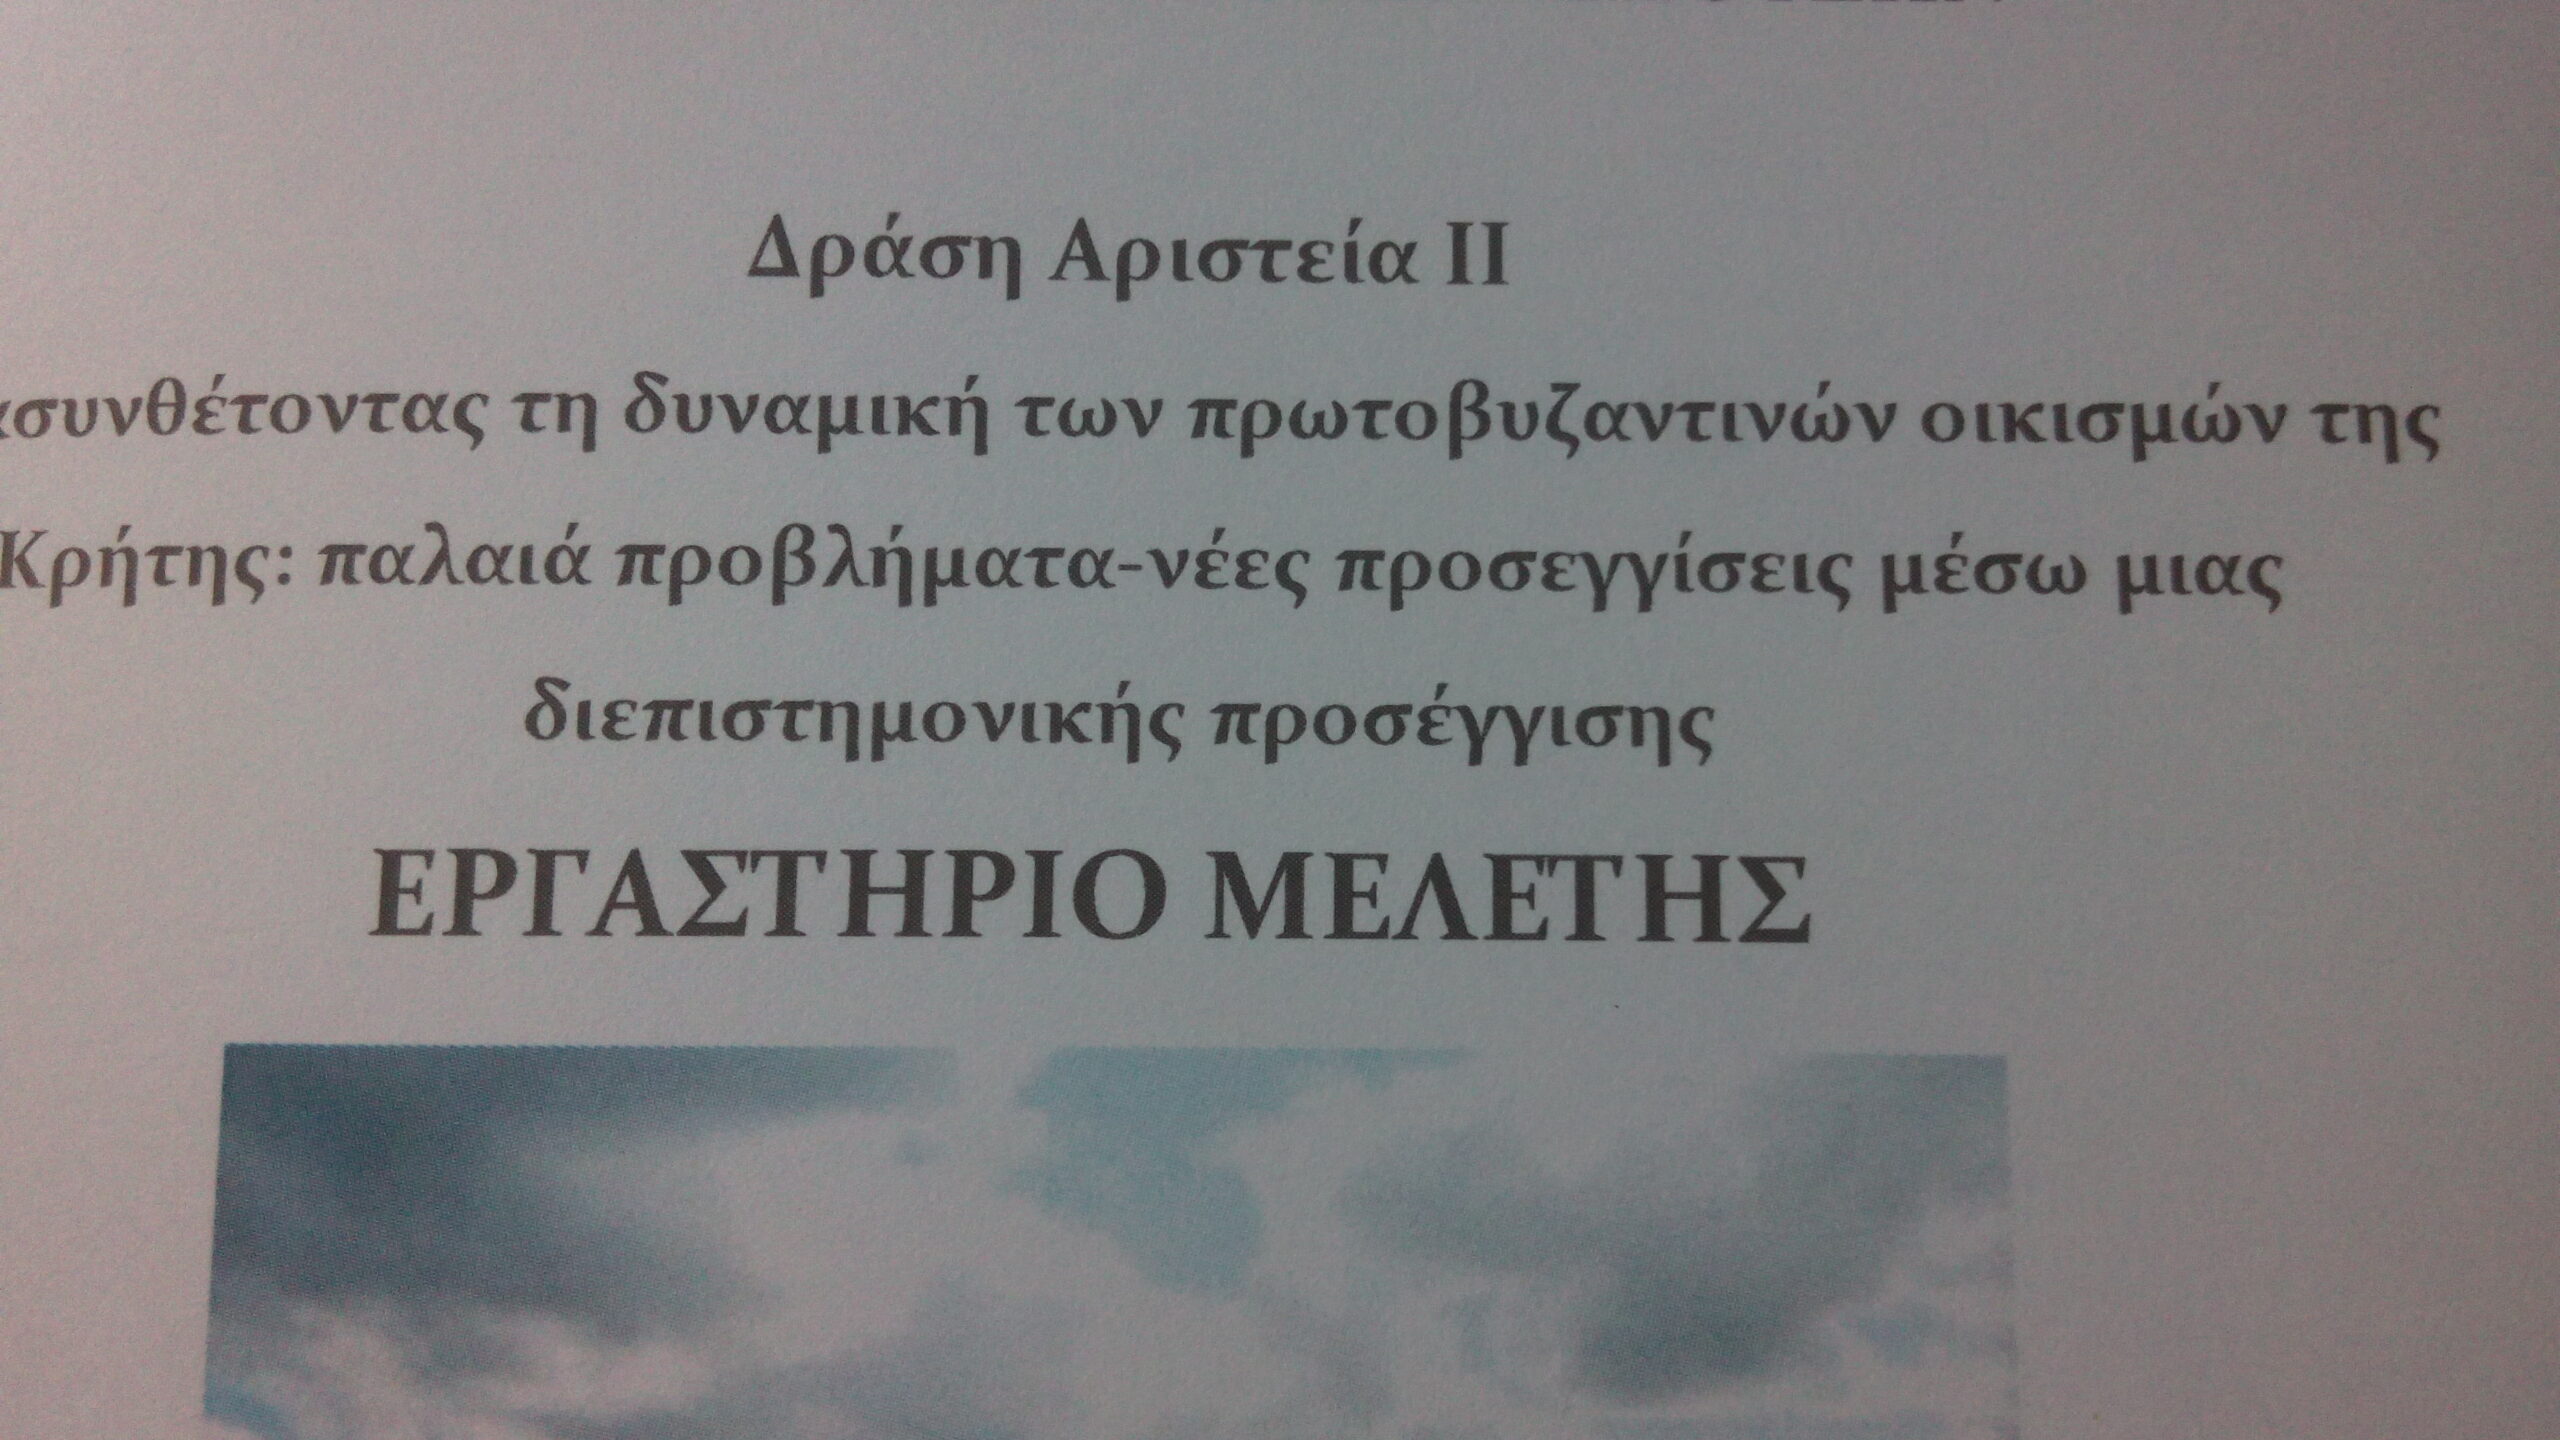
On 16th July we’re out of the Mesara to join a study seminar about the Early Byzantine settlements of Crete, organised by the Institute of Mediterranean Studies (FORTH-IMS) in Rethymno as conclusion to the DynByzCrete research project led by Christina Tsigonaki and Apostolos Sarris. I was really happy to meet other colleagues I’ve met before in various parts of Europe: Kayt Armstrong, Anastasia Yangaki, Gianluca Cantoro. Yesterday I posted the summary of my talk, apart from the conclusions.
I had the privilege of being the last speaker, and taking advantage of the fact that Anastasia Yangaki had provided a detailed overview of ceramic consumption and production in Crete from the 4th to the 9th century, I could point to some specific issues in how we date archaeological contexts with pottery and most importanly in how we prioritise ceramic studies. Ceramic specialists are a rare species, and until now we have failed to provide the means for other archaeologists to quickly identify characteristic type finds of the Early Byzantine period, with sufficient detail to avoid very generic chronologies like “5th-7th” and “8th-9th”, that are highly problematic. We also have a responsibility for the fact that studies and publications of ceramic finds are always lagging behind fieldwork, because 1) there is little selection of significant, well-dated stratigraphic contexts 2) and the study and publication have been for too long done by separating ceramic productions that were looked at separately by hyper-specialists, rather than looking at contexts as our atomic unit. Therefore, it has been impossible to provide the quantified ceramic data that are needed for the type of analytical work that it envisaged by the DynByzCrete project – and we should admit that this data will be unavailable for a long time. As a thought experiment, we could stop doing fieldwork for 25 years and dedicate most of our efforts to the study of all significant ceramic contexts from recent rescue archaeology.
If we agree that there is a potential for extracting information about social dynamics from pottery, can we also agree that provenance studies based on standardised archaeometric procedures are only one of many ways that this can be done? We know very little of the actual manufacturing of most pottery types, of the material culture that permeates their making and usage. So, taking a broader view at the DynByzCrete project, while the environmental determinism behind some of the geospatial analysis needs to leave room for the complexity of Byzantine societies (plural), it is clear that we are at a turning point in the way we look at Early Byzantine Crete, and that’s because we are starting to consider the island in its entirety instead of focusing on a single settlement, no matter how large or important. In this respect, regional surveys don’t seem to provide a qualitative advantage over prolonged excavations – and their multi-period focus is an opportunity to deal with longue durée patterns but also a rather discomforting exercise in oversimplification of changes in historical periods. Pulling an amazing variety of data, that are mostly already available and published, stress-test the obvious and non-obvious patterns of interaction (travel time by horse/donkey among known episcopal cities? Social networks of elite members as known from lead seals and written sources and epigraphy and likely connections to luxury items?) is the best way to stop repeating the same dull research questions over and over.
How can we move forward? These are difficult times, for foreign research projects and especially for Greek institutions. It seems unlikely that we will be able to work more, with more resources, on this and other related topics of Cretan history. Thus, our first aim should be to make our research more sustainable (no matter how much the term is abused): publish on the Web, encourage horizontal and vertical exchange of skills and knowledge among institutions, focus on research outputs that are reusable and continuously upgraded (and perhaps kill interim reports).