Tag: python
-
Install iosacal with conda
Starting today, you can install iosacal with conda. This adds to the existing installation procedure with pip. Conda is a good fit for complex projects and has better tooling for reproducibility. Installing iosacal can be achieved by adding conda-forge to your channels with: conda config –add channels conda-forge conda config –set channel_priority strict Once the…
-
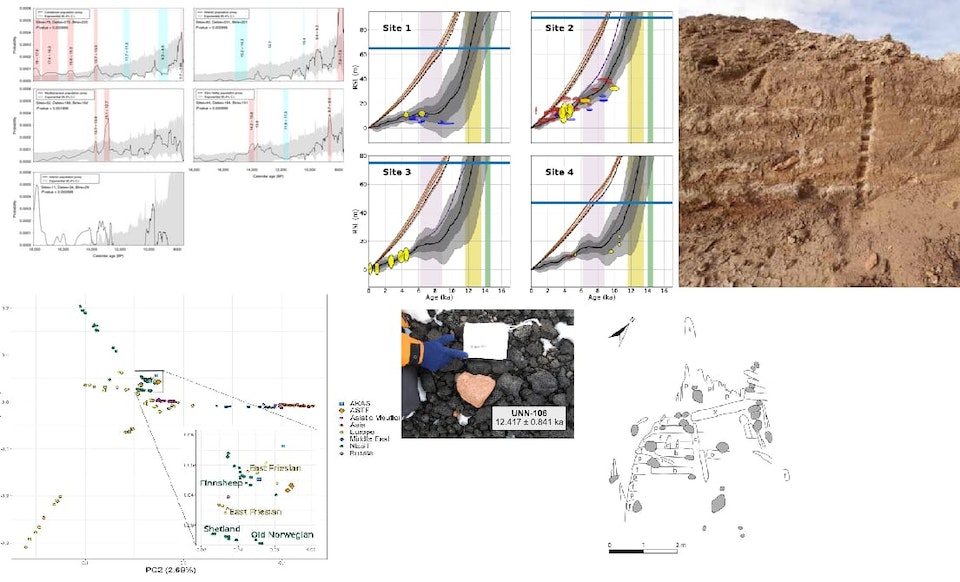
Research papers and case studies using iosacal
I have updated the documentation of iosacal with a new page that lists all research papers and case studies where the software gets a mention for being used. The list is at https://iosacal.readthedocs.io/en/latest/literature.html and it’s longer than I thought, with 6 papers ranging from Norway to Antarctica, from the Last Glacial Maximum to the European…
-
Harris Matrix Data Package: version 2022 of the hmdp tool with new features for the creation of stratigraphy data packages
A few weeks ago I presented a new version of the hmdp tool at the ARCHEOFOSS conference in Rome. You can find the archived presentation on Zenodo. Harris Matrix Data Package is a proposal for a standardised digital format of archaeological stratigraphy datasets in CSV format, following the table schema developed by Thomas S. Dye…
-
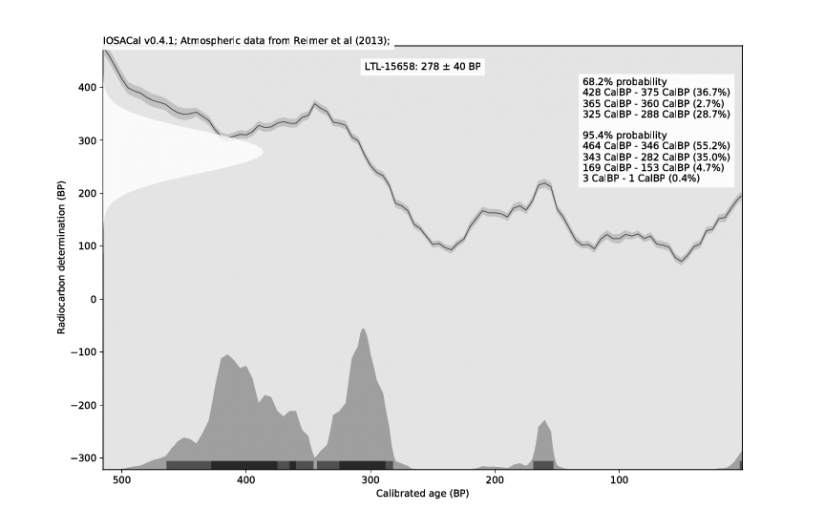
IOSACal 0.5, featuring IntCal20 and more
After three years of slow paced development, IOSACal 0.5 is here. The DOI of the latest release is https://doi.org/10.5281/zenodo.630455 As before, the preferred installation method is with pip in a virtual environment. The documentation is at https://iosacal.readthedocs.io/ This release brings the new IntCal20 calibration data and several improvements for different use cases, plus one important…
-
Total Open Station 0.4 release
This article was originally published on the Total Open Station website at https://tops.iosa.it/ After two years of slow development, I took the opportunity of some days off to finally release version 0.4, that was already available in beta since 2017. No open bugs were left and this release is mature enough to hit the repositories.…
-
IOSACal 0.4
IOSACal is an open source program for calibration of radiocarbon dates. A few days ago I released version 0.4, that can be installed from PyPI or from source. The documentation and website is at http://c14.iosa.it/ as usual. You will need to have Python 3 already installed. The main highlight of this release are the new…
-
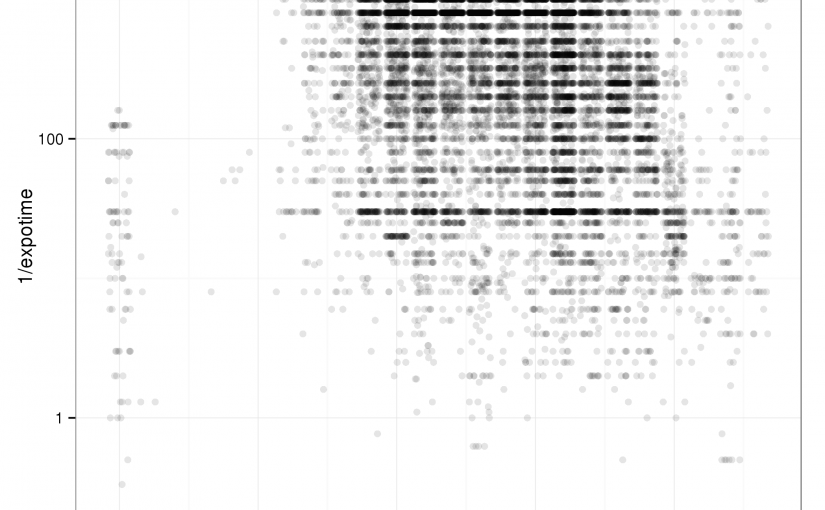
What’s the correlation between the exposure time of your photographs and the time of the day?
My digital photo archive spans 15 years and holds about 12,600 pictures (not so many, after all). I’m curious to see if there is a correlation between the exposure time of my photographs and the time of the day they were taken. A rather simplistic observation, perhaps. In short: there’s nothing spectacular about this correlation,…
-
Archaeology and Django: mind your jargon
I have been writing small Django apps for archaeology since 2009 ‒ Django 1.0 had been released a few months earlier. I love Django as a programming framework: my initial choice was based on the ORM, at that time the only geo-enabled ORM that could be used out of the box, and years later GeoDjango…